
चित्र:2005ICT.PNG

इस पूर्वावलोकन का आकार: 800 × 351 पिक्सेल। दूसरे रेसोल्यूशन्स: 320 × 140 पिक्सेल | 640 × 281 पिक्सेल | 1,425 × 625 पिक्सेल।
मूल चित्र ((1,425 × 625 पिक्सेल, फ़ाइल का आकार: 59 KB, MIME प्रकार: image/png))
|
|
यह फ़ाइल विकिमेडिया कॉमन्स से है। वहाँ पर इसका विवरण पृष्ठ निम्नोक्त है। कॉमन्स मुक्त लाइसेंसों के अंतर्गत उपलब्ध मीडिया फ़ाइलों का संग्रह है। आप भी इसमें मदद कर सकते हैं। |
| विवरण |
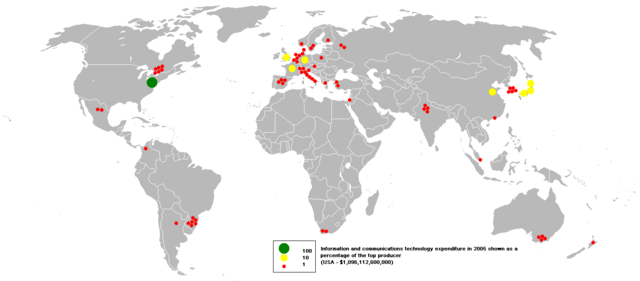
This bubble map shows the global distribution of spending on information and communication technologies in 2005 as a percentage of the top market (USA - $1,096,112,600,000). This map is consistent with incomplete set of data too as long as the top market is known. It resolves the accessibility issues faced by colour-coded maps that may not be properly rendered in old computer screens. Data was extracted on 4th July 2007 from http://siteresources.worldbank.org/DATASTATISTICS/Resources/table5_11.pdf Based on Image:BlankMap-World.png |
||
| स्रोत | Originally uploaded at en wiki by User:Anwar saadat under PD-self licence | ||
| लेखक | en:User:Anwar saadat | ||
| अनुमति (इस चित्र का पुनः उपयोग करना) |
|

|
This economic map image could be re-created using vector graphics as an SVG file. This has several advantages; see Commons:Media for cleanup for more information. If an SVG form of this image is available, please upload it and afterwards replace this template with
{{vector version available|new image name}}.
It is recommended to name the SVG file “2005ICT.svg”—then the template Vector version available (or Vva) does not need the new image name parameter. |
चित्र का इतिहास
फ़ाइलका पुराना अवतरण देखने के लिये दिनांक/समय पर क्लिक करें।
| दिनांक/समय | थंबनेल | आकार | सदस्य | प्रतिक्रिया | |
|---|---|---|---|---|---|
| वर्तमान | 01:58, 27 अक्टूबर 2007 | | 1,425 × 625 (59 KB) | Shushruth | {{Description=This bubble map shows the global distribution of spending on information and communication technologies in 2005 as a percentage of the top market (USA - $1,096,112,600,000). This map is consistent with incomplete set of data too as long as |
चित्र का उपयोग
निम्नलिखित पन्ने इस चित्र से जुडते हैं :
चित्र का वैश्विक उपयोग
इस चित्र का उपयोग इन दूसरे विकियों में किया जाता है:
- an.wikipedia.org पर उपयोग
- ar.wikipedia.org पर उपयोग
- as.wikipedia.org पर उपयोग
- ba.wikipedia.org पर उपयोग
- be-tarask.wikipedia.org पर उपयोग
- ca.wikipedia.org पर उपयोग
- es.wikipedia.org पर उपयोग
- gl.wikipedia.org पर उपयोग
- id.wikipedia.org पर उपयोग
- jv.wikipedia.org पर उपयोग
- ka.wikipedia.org पर उपयोग
- kk.wikipedia.org पर उपयोग
- kn.wikipedia.org पर उपयोग
- la.wikipedia.org पर उपयोग
- mhr.wikipedia.org पर उपयोग
- min.wikipedia.org पर उपयोग
- mk.wikipedia.org पर उपयोग
- mwl.wikipedia.org पर उपयोग
- my.wikipedia.org पर उपयोग
- ro.wikipedia.org पर उपयोग
- ru.wikipedia.org पर उपयोग
- si.wikipedia.org पर उपयोग
- sk.wikipedia.org पर उपयोग
- so.wikipedia.org पर उपयोग
- sw.wikipedia.org पर उपयोग
- tn.wikipedia.org पर उपयोग
- vi.wikipedia.org पर उपयोग
- zh.wikipedia.org पर उपयोग