
चित्र:RiemannCriticalLine.svg

पूर्वावलोकन PNG का आकार SVG फ़ाइल: 800 × 372 पिक्सेल दूसरे रेसोल्यूशन्स: 320 × 149 पिक्सेल | 640 × 298 पिक्सेल | 1,024 × 476 पिक्सेल | 1,280 × 595 पिक्सेल | 2,560 × 1,191 पिक्सेल | 933 × 434 पिक्सेल।
मूल चित्र (SVG फ़ाइल, साधारणतः 933 × 434 पिक्सेल, फ़ाइल का आकार: 50 KB)
|
|
यह फ़ाइल विकिमेडिया कॉमन्स से है। वहाँ पर इसका विवरण पृष्ठ निम्नोक्त है। कॉमन्स मुक्त लाइसेंसों के अंतर्गत उपलब्ध मीडिया फ़ाइलों का संग्रह है। आप भी इसमें मदद कर सकते हैं। |
W3C-validity not checked.
सारांश
| विवरण |
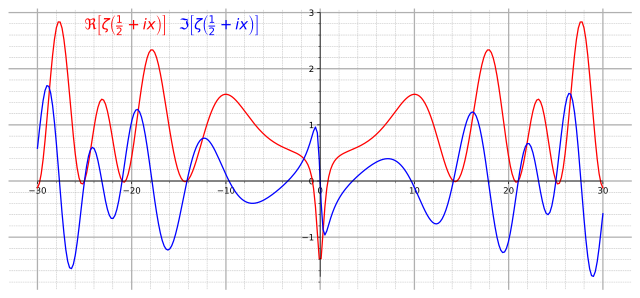
English: Graph of real (red) and imaginary (blue) parts of the critical line Re(z)=1/2 of the Riemann zeta function. |
||
| दिनांक | |||
| स्रोत |
Own work. Made with Mathematica using the following code: Show[Plot[{Re[Zeta[1/2+I x]], Im[Zeta[1/2+I x]]}, {x,-30, 30},AxesLabel->{"x"} , PlotStyle->{Red, Blue}, Ticks->{Table[4x-28,{x,0,14}]}, ImageSize->{800,600}],
Graphics[Text[Style[\[DoubleStruckCapitalR][\[Zeta][ I x + "1/2"]],14,Red ,Background ->White],{-22,2.6} ]],
Graphics[Text[Style[\[GothicCapitalI][\[Zeta][ I x + "1/2"]],14,Blue ,Background ->White],{-14,2.6} ]]] |
||
| लेखक | Slonzor | ||
| अनुमति (इस चित्र का पुनः उपयोग करना) |
Public Domain | ||
| SVG genesis | |||
| मूल कोड | Python code
|
लाइसेंस
| मैं, इस कार्य का/की कॉपीराइट धारक, इस कार्य को सार्वजनिक डोमेन में प्रकाशित करता/करती हूँ। यह पूरे विश्व में लागू होता है। कुछ देशों में यह कानूनी तौर पर नहीं हो सकता है; ऐसा हो तो: मैं सभी को इस कार्य का इस्तेमाल किसी भी उद्देश्य से, बिना किसी बाधाओं के इन शर्तों के कानून द्वारा अनिवार्य किए तक करने की अनुमति देता/देती हूँ। |
चित्र का इतिहास
फ़ाइलका पुराना अवतरण देखने के लिये दिनांक/समय पर क्लिक करें।
| दिनांक/समय | थंबनेल | आकार | सदस्य | प्रतिक्रिया | |
|---|---|---|---|---|---|
| वर्तमान | 20:01, 23 अगस्त 2017 | | 933 × 434 (50 KB) | Krishnavedala | much reduced vector version |
| 22:28, 24 सितंबर 2009 |  | 800 × 600 (122 KB) | Geek3 | linewidth=1px | |
| 19:33, 20 नवम्बर 2008 |  | 800 × 600 (122 KB) | Slonzor | Man i've messed this up a lot of times. | |
| 19:27, 20 नवम्बर 2008 |  | 800 × 600 (3.36 MB) | Slonzor | ||
| 19:23, 20 नवम्बर 2008 |  | 800 × 600 (3.36 MB) | Slonzor | ||
| 19:18, 20 नवम्बर 2008 |  | 800 × 600 (3.36 MB) | Slonzor | ||
| 19:13, 20 नवम्बर 2008 |  | 800 × 600 (79 KB) | Slonzor | {{Information |Description={{en|1=Graph of real (red) and imaginary (blue) parts of the critical line Re(z)=1/2 of the Riemann zeta function.}} |Source=Own work. Made with Mathematica using the following code: <code><nowiki>Show[Plot[{Re[Zeta[1/2+I x]], |
चित्र का उपयोग
निम्नलिखित पन्ने इस चित्र से जुडते हैं :
चित्र का वैश्विक उपयोग
इस चित्र का उपयोग इन दूसरे विकियों में किया जाता है:
- ar.wikipedia.org पर उपयोग
- ba.wikipedia.org पर उपयोग
- be.wikipedia.org पर उपयोग
- ca.wikipedia.org पर उपयोग
- ckb.wikipedia.org पर उपयोग
- da.wikipedia.org पर उपयोग
- el.wikipedia.org पर उपयोग
- en.wikipedia.org पर उपयोग
- eo.wikipedia.org पर उपयोग
- es.wikipedia.org पर उपयोग
- eu.wikipedia.org पर उपयोग
- fa.wikipedia.org पर उपयोग
- fi.wikipedia.org पर उपयोग
- he.wikipedia.org पर उपयोग
- hy.wikipedia.org पर उपयोग
- id.wikipedia.org पर उपयोग
- it.wikipedia.org पर उपयोग
- it.wikiquote.org पर उपयोग
- ja.wikipedia.org पर उपयोग
- ko.wikipedia.org पर उपयोग
- la.wikipedia.org पर उपयोग
- mn.wikipedia.org पर उपयोग
- nn.wikipedia.org पर उपयोग
- no.wikipedia.org पर उपयोग
- pa.wikipedia.org पर उपयोग
- pt.wikipedia.org पर उपयोग
- ru.wikipedia.org पर उपयोग
- sl.wikipedia.org पर उपयोग
- sq.wikipedia.org पर उपयोग
- sr.wikipedia.org पर उपयोग
- uk.wikipedia.org पर उपयोग
- vi.wikipedia.org पर उपयोग
- zh-yue.wikipedia.org पर उपयोग
- zh.wikipedia.org पर उपयोग
इस चित्र के वैश्विक उपयोग की अधिक जानकारी देखें।