
चित्र:CO2 increase rate.png

इस पूर्वावलोकन का आकार: 800 × 582 पिक्सेल। दूसरे रेसोल्यूशन्स: 320 × 233 पिक्सेल | 640 × 465 पिक्सेल | 1,024 × 745 पिक्सेल | 1,280 × 931 पिक्सेल | 1,650 × 1,200 पिक्सेल।
मूल चित्र ((1,650 × 1,200 पिक्सेल, फ़ाइल का आकार: 21 KB, MIME प्रकार: image/png))
|
|
यह फ़ाइल विकिमेडिया कॉमन्स से है। वहाँ पर इसका विवरण पृष्ठ निम्नोक्त है। कॉमन्स मुक्त लाइसेंसों के अंतर्गत उपलब्ध मीडिया फ़ाइलों का संग्रह है। आप भी इसमें मदद कर सकते हैं। |
सारांश

|
This graph image could be re-created using vector graphics as an SVG file. This has several advantages; see Commons:Media for cleanup for more information. If an SVG form of this image is available, please upload it and afterwards replace this template with
{{vector version available|new image name}}.
It is recommended to name the SVG file “CO2 increase rate.svg”—then the template Vector version available (or Vva) does not need the new image name parameter. |
| विवरण |
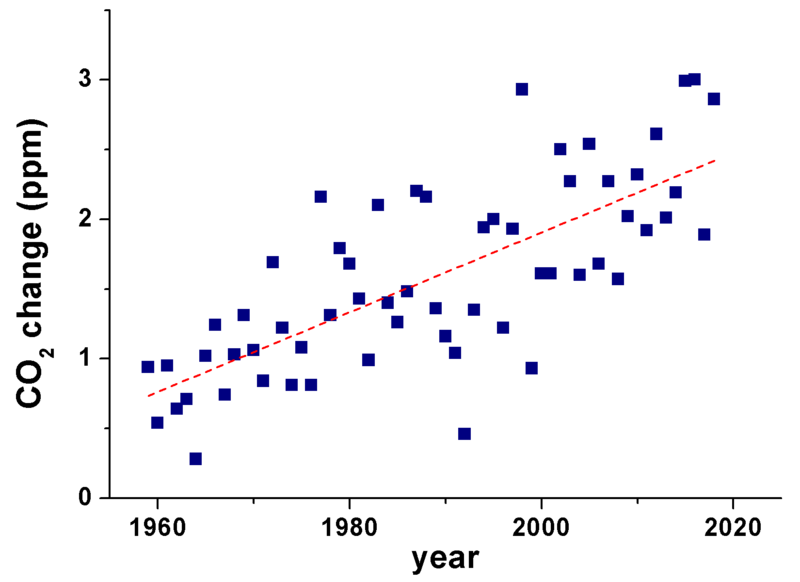
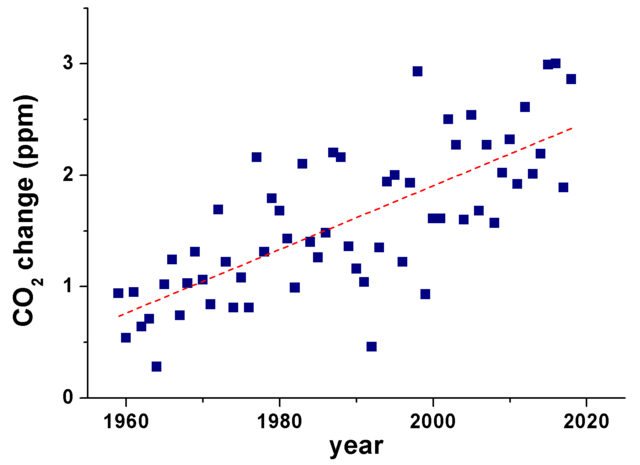
English: Year-over-year increase of atmospheric CO2 |
| दिनांक | Renerpho (वार्ता) 08:45, 9 May 2019 (UTC) |
| स्रोत | Updated the old chart (1959-2007) by New Image Uploader 929, with more recent data up to 2018 from Pieter Tans "Annual CO2 mole fraction increase (ppm)" for 1959-2018 National Oceanic and Atmospheric Administration |
| लेखक | Renerpho (talk) |
| दूसरे संस्करण | العربيَّة |
लाइसेंस
Renerpho at the English Wikipedia, इस कार्य के कॉपीराइट धारक, इसे निम्न लाइसेंस के अंतर्गत प्रकाशित करते हैं:

|
इस दस्तावेज़ को Free Software Foundation द्वारा प्रकाशित GNU मुक्त प्रलेख लाइसेंस के संस्करण 1.2 या नए (बिना किसी अपरिवर्तनीय अनुभागों और अगले या पिछले आवरण के टेक्स्ट के) के अंतर्गत प्रतिलिपि बनाने, बाँटने और/या बदलने की अनुमति प्रदान की जाती है। इस लाइसेंस की एक प्रतिलिपि GNU मुक्त प्रलेख लाइसेंस नामक अनुभाग में शामिल है। |
| इस फ़ाइल को क्रिएटिव कॉमन्स श्रेय-समानसांझा 3.0 अनरिपोर्टेड लाइसेंस के अंतर्गत लाइसेंस किया गया है। | ||
| श्रेय: Renerpho at the English Wikipedia | ||
| ||
| This licensing tag was added to this file as part of the GFDL licensing update. |
मूल अपलोड लॉग
Transferred from en.wikipedia to Commons by Teratornis using CommonsHelper.
The original description page was here. All following user names refer to en.wikipedia.
- 2008-05-30 11:01 New Image Uploader 929 690×600× (16333 bytes)
- 2008-05-30 08:01 New Image Uploader 929 561×395× (14292 bytes) slightly better?
- 2008-05-30 07:57 New Image Uploader 929 561×395× (13023 bytes) label axes
- 2008-05-30 03:21 New Image Uploader 929 539×379× (10732 bytes) {{Information |Description=Year-over-year increase in atmospheric CO<sub>2</sub> increase. |Source=I created this image with help (numerical data only) from Dr. Pieter Tans (3 May 2008) [ftp://ftp.cmdl.noaa.gov/ccg/co2/trends/co2_gr_mlo.txt
चित्र का इतिहास
फ़ाइलका पुराना अवतरण देखने के लिये दिनांक/समय पर क्लिक करें।
| दिनांक/समय | थंबनेल | आकार | सदस्य | प्रतिक्रिया | |
|---|---|---|---|---|---|
| वर्तमान | 08:38, 9 मई 2019 | | 1,650 × 1,200 (21 KB) | Renerpho | Update, adding 10 years (2009-2018) and a linear fit. |
| 07:36, 8 अक्टूबर 2009 |  | 690 × 600 (16 KB) | File Upload Bot (Magnus Manske) | {{BotMoveToCommons|en.wikipedia|year={{subst:CURRENTYEAR}}|month={{subst:CURRENTMONTHNAME}}|day={{subst:CURRENTDAY}}}} {{Information |Description={{en|Year-over-year increase of atmospheric CO<sub>2</sub>}} |Source=Transferred from [http://en.wikipedia.o |
चित्र का उपयोग
निम्नलिखित पन्ने इस चित्र से जुडते हैं :
चित्र का वैश्विक उपयोग
इस चित्र का उपयोग इन दूसरे विकियों में किया जाता है:
- ar.wikipedia.org पर उपयोग
- ast.wikipedia.org पर उपयोग
- ca.wikipedia.org पर उपयोग
- en.wikipedia.org पर उपयोग
- es.wikipedia.org पर उपयोग
- fr.wikipedia.org पर उपयोग
- gu.wikipedia.org पर उपयोग
- id.wikipedia.org पर उपयोग
- ta.wikipedia.org पर उपयोग
- te.wikipedia.org पर उपयोग
- uk.wikipedia.org पर उपयोग