
चित्र:United States Commercial Paper 2001 to 2007.svg

पूर्वावलोकन PNG का आकार SVG फ़ाइल: 450 × 338 पिक्सेल दूसरे रेसोल्यूशन्स: 320 × 240 पिक्सेल | 639 × 480 पिक्सेल | 1,023 × 768 पिक्सेल | 1,280 × 961 पिक्सेल | 2,560 × 1,923 पिक्सेल।
मूल चित्र (SVG फ़ाइल, साधारणतः 450 × 338 पिक्सेल, फ़ाइल का आकार: 28 KB)
|
|
यह फ़ाइल विकिमेडिया कॉमन्स से है। वहाँ पर इसका विवरण पृष्ठ निम्नोक्त है। कॉमन्स मुक्त लाइसेंसों के अंतर्गत उपलब्ध मीडिया फ़ाइलों का संग्रह है। आप भी इसमें मदद कर सकते हैं। |
सारांश
| विवरण |
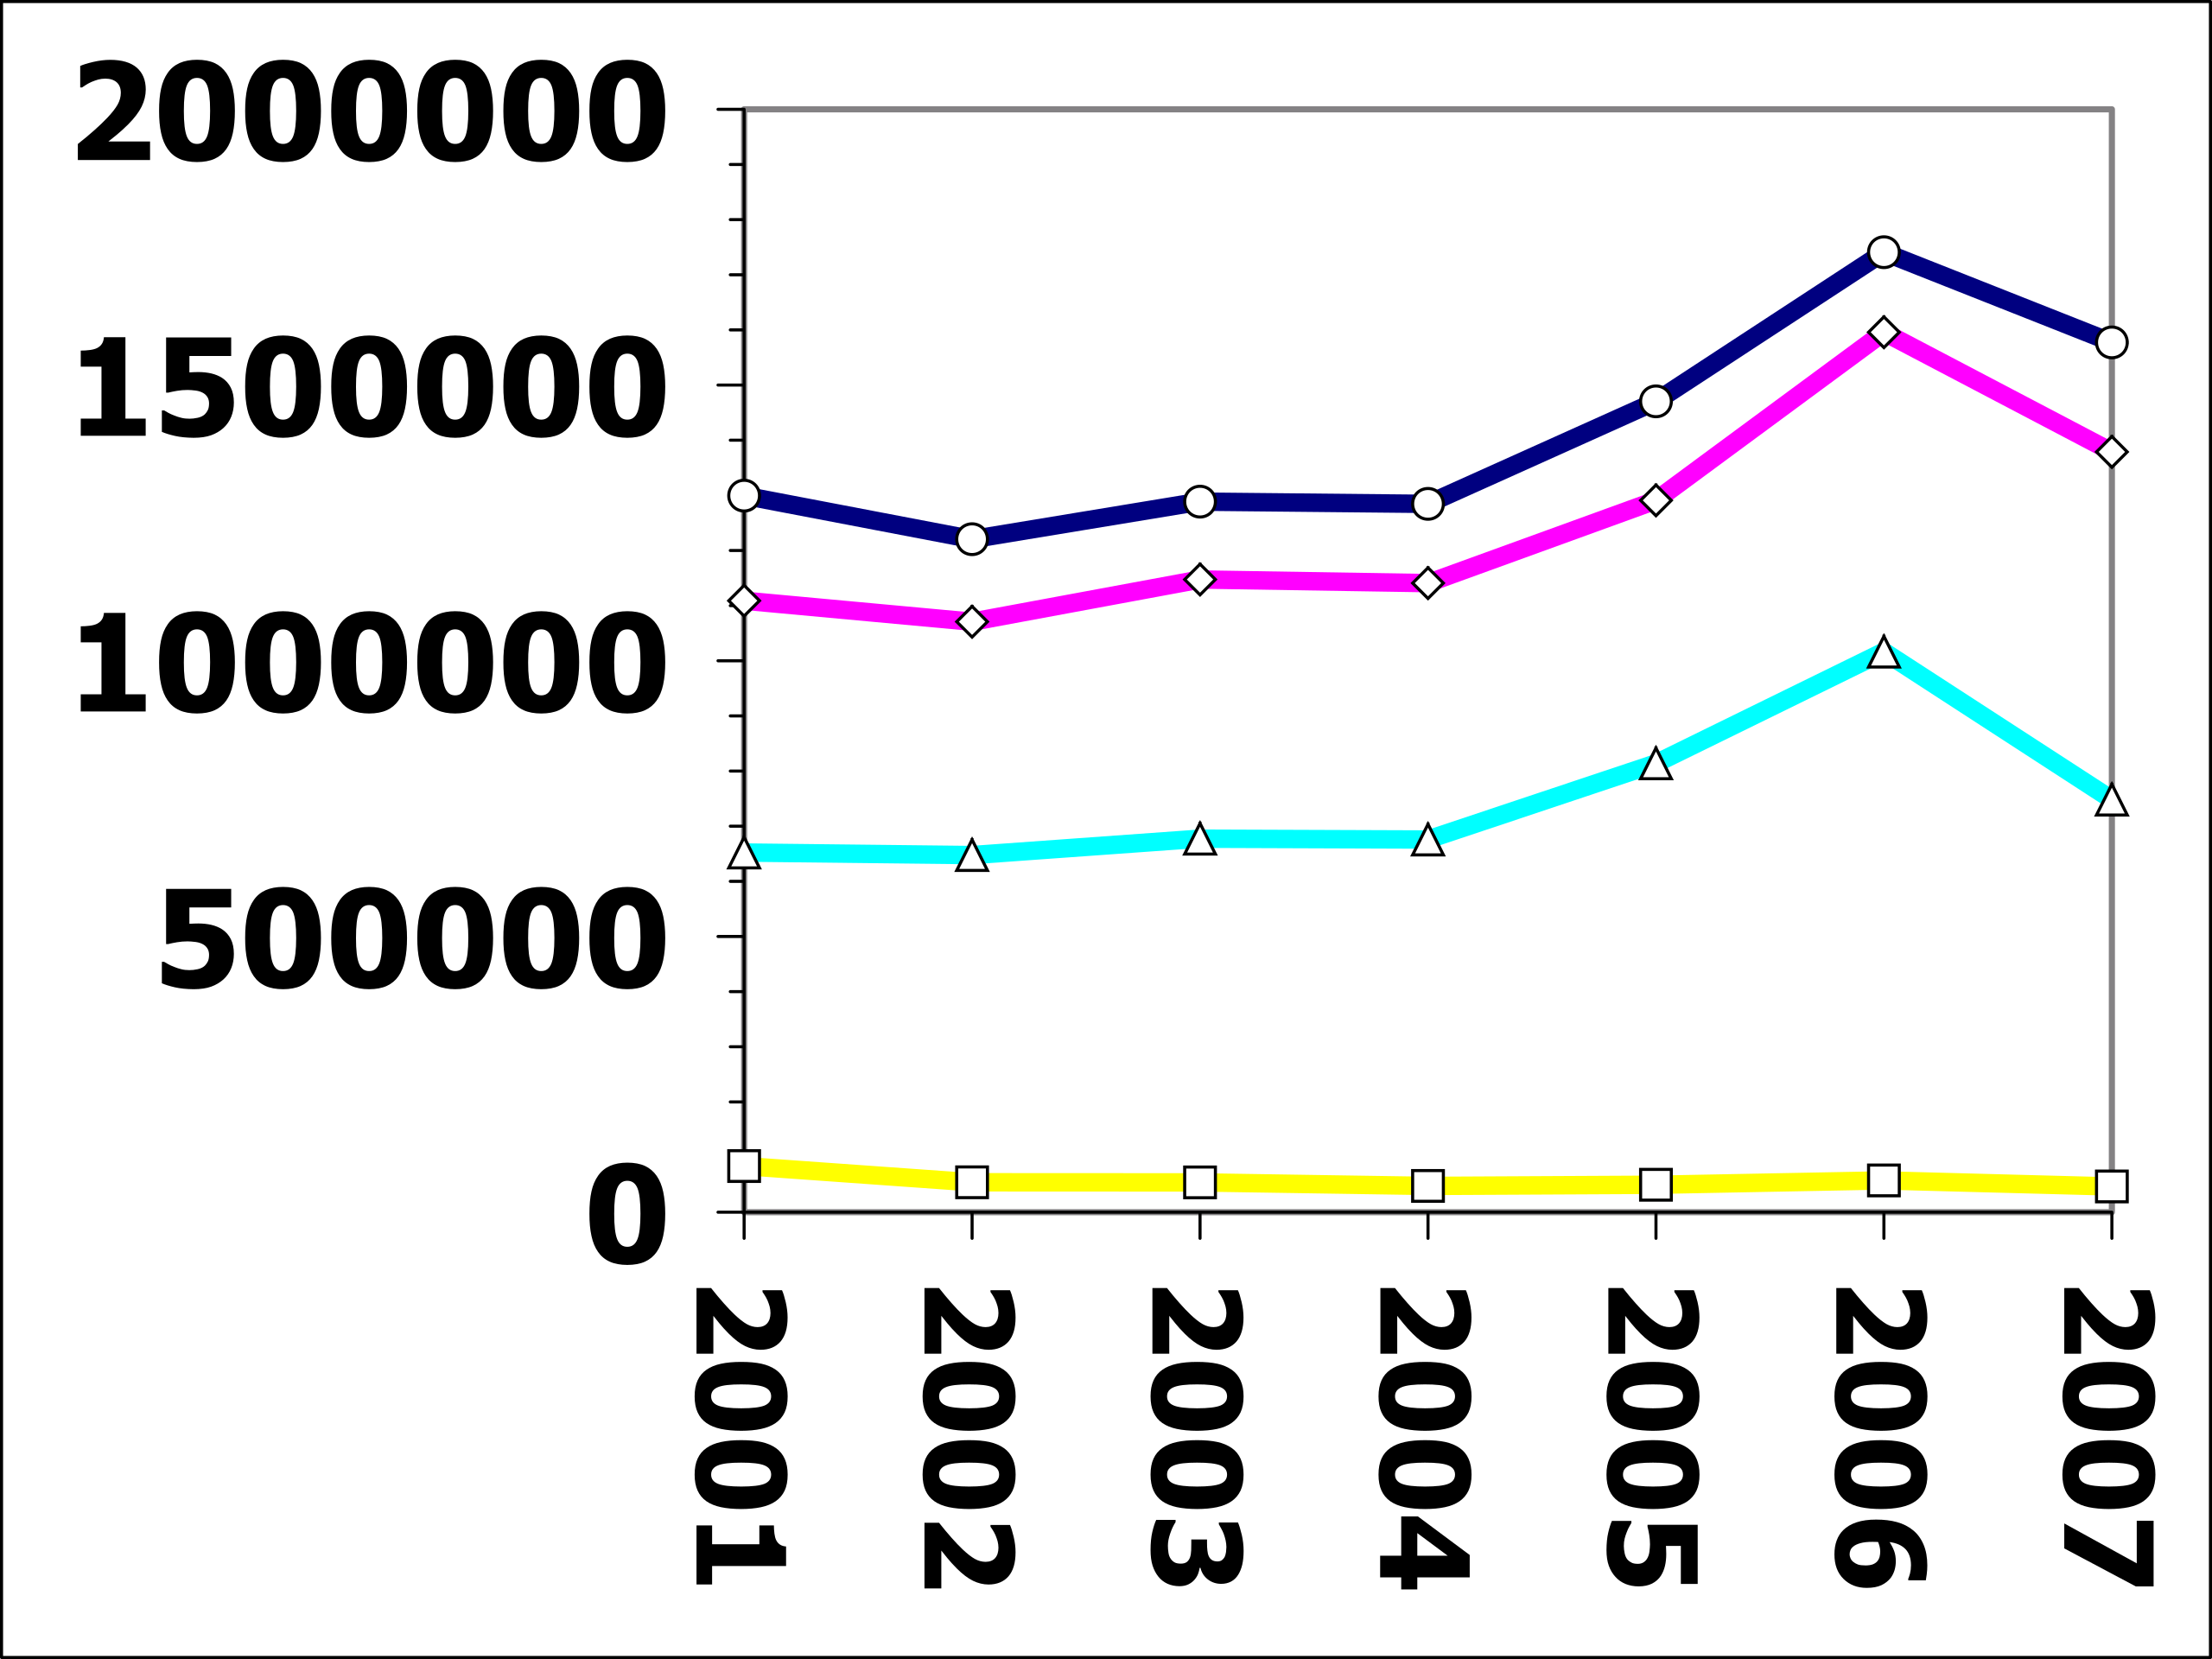
English: United States Commercial Paper outstanding at end of each year 2001 to 2007. Vertical scale shows debt in millions of dollars, horizontal scale shows years. All markers indicate commercial paper outstanding, maturing after December 31. Circles on blue line indicate Total commercial paper; triangles diamonds on pink line indicate SEC rule 2a-7 tier-1 commercial paper; triangles on blue line indicate Asset-backed commercial paper; squares on yellow line indicate SEC rule 2a-7 tier-2 commercial paper. No titles version. |
| दिनांक | |
| स्रोत | I, 84user, created this work using data from the United State's Federal Reserve Board Commercial Paper - last released Friday, October 31, 2008, chosen from [1], using Open Source Gnumeric 1.9.1 to produce the chart. |
| लेखक | 84user |
| अनुमति (इस चित्र का पुनः उपयोग करना) |
PD-SELF; Released into the public domain (by the author). |
| दूसरे संस्करण |
 |
लाइसेंस
| इस कार्य को इसके लेखक, 84user द्वारा सार्वजनिक डोमेन में प्रकाशित किया गया है। यह पूरे विश्व में लागू होता है। कुछ देशों में यह कानूनी तौर पर नहीं हो सकता है; ऐसा हो तो: |
Data used to create this in CSV format - click on the triangle to the right
"Series Description","Commercial Paper Outstanding; Maturing After December 31","Commercial Paper Outstanding, Tier-1; Maturing After December 31","Commercial Paper Outstanding, Tier-2; Maturing After December 31","Asset-backed Commercial Paper Outstanding; Maturing After December 31",,,,,,,
Unit:,Currency,Currency,Currency,Currency,,,,,,,
Multiplier:,1000000,1000000,1000000,1000000,,,,,,,
Currency:,USD,USD,USD,USD,,,,,,,
"Unique Identifier:",CP/OUTST_YREND/DTBSPCK_N.YREND.WW,CP/OUTST_YREND/DTBSPCKCT1_N.YREND.WW,CP/OUTST_YREND/DTBSPCKCT2_N.YREND.WW,CP/OUTST_YREND/DTBSPCKA_N.YREND.WW,,,,,,,
"Time Period",DTBSPCK_N.YREND.WW,DTBSPCKCT1_N.YREND.WW,DTBSPCKCT2_N.YREND.WW,DTBSPCKA_N.YREND.WW,,,"Year end",Total,,,
2001/12/26,1299452.8749,1108927.1468,83695.265639,652210.76176,,,2001/12/26,3144286.049099,,,
2002/12/25,1220454.657,1070818.6483,54253.38968,647632.06236,,,2002/12/25,2993158.75734,,,
2003/12/31,1288570.7327,1147390.78,54064.958144,677330.55626,,,2003/12/31,3167357.027104,,,
2004/12/29,1284525.8757,1140816.9591,47639.74655,675807.29289,,,2004/12/29,3148789.87424,,,
2005/12/28,1470437.4557,1290890.2504,49765.128876,813943.56633,,,2005/12/28,3625036.401306,,,
2006/12/27,1740912.6149,1595815.0403,57629.836117,1016505.4376,,,2006/12/27,4410862.928917,,,
2007/12/26,1577300.4541,1378786.6841,46707.354,748168.70307,,,2007/12/26,3750963.19527,,,
,,,,,,,,,,,
" Source","Year-end outstandings from Commercial Paper link on https://www.federalreserve.gov/datadownload/",,,,,,,,,,
चित्र का इतिहास
फ़ाइलका पुराना अवतरण देखने के लिये दिनांक/समय पर क्लिक करें।
| दिनांक/समय | थंबनेल | आकार | सदस्य | प्रतिक्रिया | |
|---|---|---|---|---|---|
| वर्तमान | 14:37, 31 अक्टूबर 2008 | | 450 × 338 (28 KB) | 84user | {{Information |Description={{en|United States Commercial Paper outstanding at end of each year 2001 to 2007. Vertical scale shows debt in millions of dollars, horizontal scale shows years. All markers indicate commercial paper outstanding, maturing after |
चित्र का उपयोग
निम्नलिखित पन्ने इस चित्र से जुडते हैं :
चित्र का वैश्विक उपयोग
इस चित्र का उपयोग इन दूसरे विकियों में किया जाता है:
- en.wikipedia.org पर उपयोग
- ga.wikipedia.org पर उपयोग