
चित्र:XYZ-DIS magnetic field coordinates.svg

पूर्वावलोकन PNG का आकार SVG फ़ाइल: 512 × 175 पिक्सेल दूसरे रेसोल्यूशन्स: 320 × 109 पिक्सेल | 640 × 219 पिक्सेल | 1,024 × 350 पिक्सेल | 1,280 × 438 पिक्सेल | 2,560 × 875 पिक्सेल।
मूल चित्र (SVG फ़ाइल, साधारणतः 512 × 175 पिक्सेल, फ़ाइल का आकार: 8 KB)
|
|
यह फ़ाइल विकिमेडिया कॉमन्स से है। वहाँ पर इसका विवरण पृष्ठ निम्नोक्त है। कॉमन्स मुक्त लाइसेंसों के अंतर्गत उपलब्ध मीडिया फ़ाइलों का संग्रह है। आप भी इसमें मदद कर सकते हैं। |
सारांश
| विवरण |
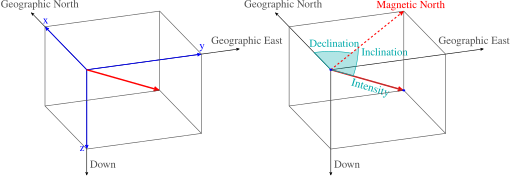
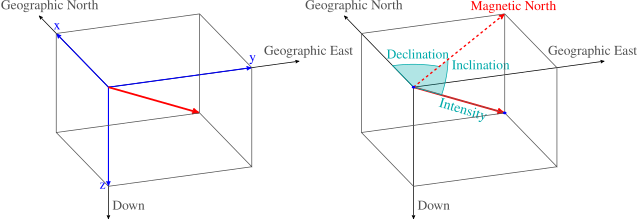
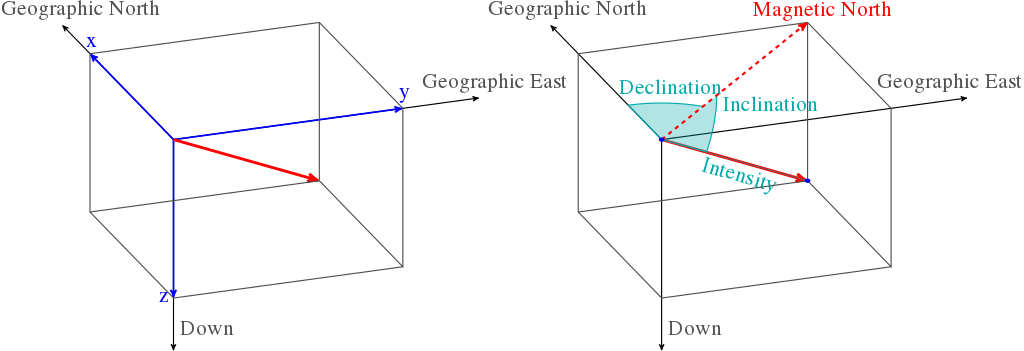
English: The graphic serves to represent the analogy of the XYZ and the more commonly used DIS coordinate systems. Blue indicated the coordinates in the two different systems, while red indicates the resultant magnetic field. |
| दिनांक | |
| स्रोत |
अपना कार्य |
| लेखक |
Chymæra Recreated in LaTeX by: Rubber Duck (☮ • ✍) |
| SVG genesis | इस वेक्टर चित्र को LaTeX की मदद से Rubber Duck (☮ • ✍) द्वारा बनाया गया था and converted to SVG using dvisvgm and manually edited. |
| मूल कोड | SVG code\documentclass[12pt,border=0pt,tikz,class=scrartcl,multi=false]{standalone}
\usepackage{times}
\usepackage{pgfplots}
\pgfplotsset{compat=1.10}
\usetikzlibrary{arrows,decorations.text}
\usepackage{tikz-3dplot}
\pagestyle{empty}
\begin{document}
\def\LA{2}
\def\Lb{1.5}
\def\gap{1.5cm}
\tdplotsetmaincoords {-60}{70}
\begin{tikzpicture}[thick,auto,>=stealth',xscale=4,yscale=3,tdplot_main_coords]
\begin{scope} [xshift=-\gap]
\draw [->] (0,0,0) -- (-\LA,0,0) node [anchor=south,gray] {Geographic North};
\draw [->] (0,0,0) -- (0,\LA,0) node [anchor=south,gray] {Geographic East};
\draw [->] (0,0,0) -- (0,0,\LA) node [pos=.9,right,gray] {Down};
\draw [->,blue,very thick] (0,0,0) -- (-\Lb,0,0) node [anchor=south] {x};
\draw [->,blue,very thick] (0,0,0) -- (0,\Lb,0) node [anchor=south] {y};
\draw [->,blue,very thick] (0,0,0) -- (0,0,\Lb) node [left] {z};
\draw [->,red,line width=2pt] (0,0,0) -- (-\Lb,\Lb,\Lb);
\draw [gray] (-\Lb,0,0) -- ++(0,\Lb,0) -- ++(\Lb,0,0)
-- ++(0,0,\Lb) -- ++(-\Lb,0,0) -- ++(0,0,-\Lb)
(-\Lb,0,0) -- ++(0,0,\Lb) -- ++(\Lb,0,0) -- ++(0,\Lb,0)
(-\Lb,0,\Lb) -- ++(0,\Lb,0)
;
\end{scope}
\begin{scope} [xshift=\gap]
\draw [->] (0,0,0) -- (-\LA,0,0) node [anchor=south,gray] {Geographic North};
\draw [->] (0,0,0) -- (0,\LA,0) node [anchor=south,gray] {Geographic East};
\draw [->] (0,0,0) -- (0,0,\LA) node [pos=.9,right,gray] {Down};
\draw [->,red,line width=2pt] (0,0,0) -- (-\Lb,\Lb,\Lb);
\draw [thin,cyan,postaction={decoration={text along path,
raise=-10pt,text color=cyan,text align={center},
text={Intensity} },decorate}]
(0,0,0) -- (-\Lb,\Lb,\Lb);
\tdplotsetthetaplanecoords{135};
%\tdplotdrawarc [tdplot_rotated_coords,cyan] {(0,0,0)} {.8} {55}{90}{above right=5pt and 0pt}{Inclination};
\draw [tdplot_rotated_coords,fill=cyan,fill opacity=.3,cyan] (0,.8,0)
arc (90:55:.8) node [pos=.1,right,opacity=1] {Inclination}
-- (0,0,0);
%\tdplotdrawarc [cyan,fill=cyan] {(0,0,0)} {.6} {180}{135}{above}{Declination};
\draw [cyan,fill=cyan,fill opacity=.3] (0,0,0) -- (-.6,0,0)
arc (180:135:.6) node [above,pos=.5,opacity=1] {Declination};
\draw [gray] (-\Lb,0,0) -- ++(0,\Lb,0) -- ++(\Lb,0,0)
-- ++(0,0,\Lb) -- ++(-\Lb,0,0) -- ++(0,0,-\Lb)
(-\Lb,0,0) -- ++(0,0,\Lb) -- ++(\Lb,0,0) -- ++(0,\Lb,0)
(-\Lb,0,\Lb) -- ++(0,\Lb,0)
;
\draw [->,red,dashed, line width=1.5pt] (0,0,0) -- (-\Lb,\Lb,0) node [anchor=south] {Magnetic North};
\draw [fill=blue,draw=none] (0,0,0) circle (.5pt) (-\Lb,\Lb,\Lb) circle (.5pt);
\end{scope}
\end{tikzpicture}
\end{document}
|

|
इस SVG फ़ाइल में एम्बेड किया हुआ टेक्स्ट है जिसे आप अपनी भाषा में किसी भी सक्षम SVG एडिटर, टेक्स्ट एडिटर, या फिर SVG Translate उपकरण की मदद से अनुवादित कर सकते हैं। अधिक जानकारी के लिए देखें: SVG फ़ाइलों को अनुवादित करने के बारे में। |
लाइसेंस
मैं, इस कार्य का/की कॉपीराइट धारक, इसे निम्न लाइसेंस के अंतर्गत प्रकाशित करता/करती हूँ:
इस फ़ाइल को क्रिएटिव कॉमन्स श्रेय-समानसांझा 3.0 अनरिपोर्टेड लाइसेंस के अंतर्गत लाइसेंस किया गया है।
- आप खुलकर:
- बाँट सकते हैं – रचना की प्रतिलिपि बना सकते हैं, बाँँट सकते हैं और संचारित कर सकते हैं
- रीमिक्स कर सकते हैं – कार्य को अनुकूलित कर सकते हैं
- निम्नलिखित शर्तों के अंतर्गत:
- श्रेय – यह अनिवार्य है कि आप यथोचित श्रेय प्रदान करें, लाइसेंस की कड़ी प्रदान करें, और अगर कोई बदलाव हुए हों तो उन्हें इंगित करें। आप ऐसा किसी भी उचित तरीके से कर सकते हैं, लेकिन किसी भी तरह उससे यह नहीं संकेत नहीं किया जाना चाहिए कि लाइसेंसधारी द्वारा आपको अथवा आपके इस प्रयोग का समर्थन किया जा रहा हो।
- समानसांझा – अगर आप इस रचना में कोई बदलाव करते हैं या इसपर आधारित कुछ रचित करते हैं तो आप अपने योगदान को सिर्फ इसी या इसके सामान किसी लाइसेंस के अंतर्गत बाँट सकते हैं।
चित्र का इतिहास
फ़ाइलका पुराना अवतरण देखने के लिये दिनांक/समय पर क्लिक करें।
| दिनांक/समय | थंबनेल | आकार | सदस्य | प्रतिक्रिया | |
|---|---|---|---|---|---|
| वर्तमान | 19:26, 22 अप्रैल 2015 | 512 × 175 (8 KB) | Krishnavedala | increased font size and more optimized | |
| 19:17, 22 अप्रैल 2015 | 892 × 306 (8 KB) | Krishnavedala | Better drawing with bigger and legible translatable fonts. | ||
| 02:17, 8 जून 2012 |  | 644 × 266 (27 KB) | Chymæra | font issues | |
| 01:58, 8 जून 2012 |  | 644 × 266 (29 KB) | Chymæra | {{subst:Upload marker added by en.wp UW}} {{Information |Description = {{en|The graphic serves to represent the analogy of the XYZ and the more commonly used DIS coordinate systems. Blue indicated the coordinates in the two different systems, while red... |
चित्र का उपयोग
निम्नलिखित पन्ने इस चित्र से जुडते हैं :
चित्र का वैश्विक उपयोग
इस चित्र का उपयोग इन दूसरे विकियों में किया जाता है:
- ast.wikipedia.org पर उपयोग
- bn.wikipedia.org पर उपयोग
- ca.wikipedia.org पर उपयोग
- en.wikipedia.org पर उपयोग
- es.wikipedia.org पर उपयोग
- it.wikibooks.org पर उपयोग
- it.wikiversity.org पर उपयोग
- or.wikipedia.org पर उपयोग
- pt.wikipedia.org पर उपयोग
- tr.wikipedia.org पर उपयोग
- vi.wikipedia.org पर उपयोग