
चित्र:Gdp-and-labour-force-by-sector.png
इस पूर्वावलोकन का आकार: 680 × 599 पिक्सेल। दूसरे रेसोल्यूशन्स: 272 × 240 पिक्सेल | 545 × 480 पिक्सेल | 871 × 768 पिक्सेल | 1,162 × 1,024 पिक्सेल | 1,425 × 1,256 पिक्सेल।
मूल चित्र ((1,425 × 1,256 पिक्सेल, फ़ाइल का आकार: 116 KB, MIME प्रकार: image/png))
|
|
यह फ़ाइल विकिमेडिया कॉमन्स से है। वहाँ पर इसका विवरण पृष्ठ निम्नोक्त है। कॉमन्स मुक्त लाइसेंसों के अंतर्गत उपलब्ध मीडिया फ़ाइलों का संग्रह है। आप भी इसमें मदद कर सकते हैं। |
सारांश
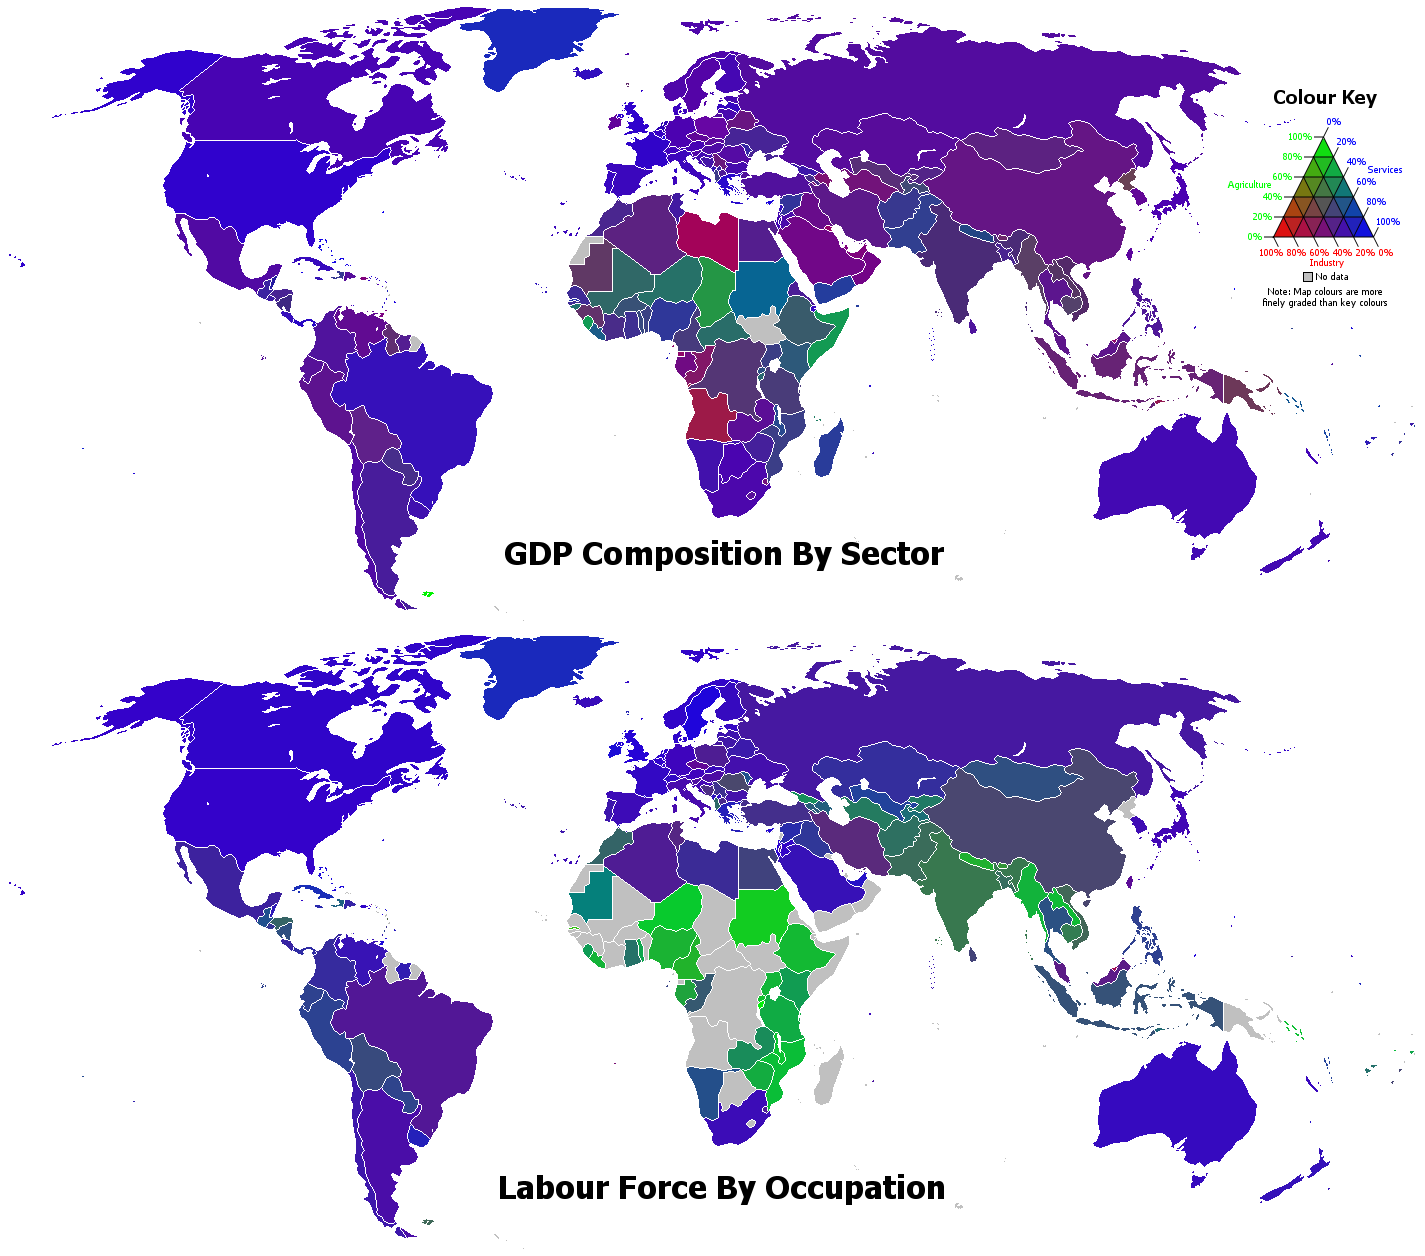
| विवरण | GDP Composition By Sector and Labour Force By Occupation, produced using data from the CIA World Factbook 2006. The green, red, and blue components of the colors of the countries represent the percentages for the agriculture, industry, and services sectors respectively, as summarized on the color key - for example, rgb(102,51,201) represents 20% agriculture, 40% industry, and 40% services. |
| दिनांक | UTC |
| स्रोत | अपना कार्य |
| लेखक | Safalra (Stephen Morley) |
लाइसेंस
| मैं, इस कार्य का/की कॉपीराइट धारक, इस कार्य को सार्वजनिक डोमेन में प्रकाशित करता/करती हूँ। यह पूरे विश्व में लागू होता है। कुछ देशों में यह कानूनी तौर पर नहीं हो सकता है; ऐसा हो तो: मैं सभी को इस कार्य का इस्तेमाल किसी भी उद्देश्य से, बिना किसी बाधाओं के इन शर्तों के कानून द्वारा अनिवार्य किए तक करने की अनुमति देता/देती हूँ। |
चित्र का इतिहास
फ़ाइलका पुराना अवतरण देखने के लिये दिनांक/समय पर क्लिक करें।
| दिनांक/समय | थंबनेल | आकार | सदस्य | प्रतिक्रिया | |
|---|---|---|---|---|---|
| वर्तमान | 02:21, 30 अक्टूबर 2018 | | 1,425 × 1,256 (116 KB) | Ketrit | Minor fixes |
| 01:38, 30 अक्टूबर 2018 |  | 1,425 × 1,256 (116 KB) | Ketrit | Updated for 2018. | |
| 15:27, 18 सितंबर 2006 |  | 1,357 × 1,256 (90 KB) | Safalra | {{Information |Description = GDP Composition By Sector and Labour Force By Occupation, produced using data from the CIA World Factbook 2006. The green, red, and blue components of the colours of the countries represent the percentages for the agriculture, | |
| 15:21, 18 सितंबर 2006 |  | 1,357 × 1,256 (90 KB) | Safalra | == Summary == {{Information |Description = GDP Composition By Sector and Labour Force By Occupation, produced using data from the CIA World Factbook 2006. The green, red, and blue components of the colours of the countries represent the percentages for th |
चित्र का उपयोग
निम्नलिखित पन्ने इस चित्र से जुडते हैं :
चित्र का वैश्विक उपयोग
इस चित्र का उपयोग इन दूसरे विकियों में किया जाता है:
- ar.wikipedia.org पर उपयोग
- br.wikipedia.org पर उपयोग
- ca.wikipedia.org पर उपयोग
- ceb.wikipedia.org पर उपयोग
- ckb.wikipedia.org पर उपयोग
- co.wikipedia.org पर उपयोग
- crh.wikipedia.org पर उपयोग
- cs.wikipedia.org पर उपयोग
- da.wikipedia.org पर उपयोग
- el.wikipedia.org पर उपयोग
- en.wikipedia.org पर उपयोग
- fa.wikipedia.org पर उपयोग
- fr.wikipedia.org पर उपयोग
- hu.wikipedia.org पर उपयोग
- hy.wikipedia.org पर उपयोग
- it.wikipedia.org पर उपयोग
- it.wikibooks.org पर उपयोग
- ja.wikipedia.org पर उपयोग
- kk.wikipedia.org पर उपयोग
- ko.wikipedia.org पर उपयोग
- lez.wikipedia.org पर उपयोग
- lo.wikipedia.org पर उपयोग
- lt.wikipedia.org पर उपयोग
- mk.wikipedia.org पर उपयोग
- ml.wikipedia.org पर उपयोग
- my.wikipedia.org पर उपयोग
- ne.wikipedia.org पर उपयोग
- new.wikipedia.org पर उपयोग
- pa.wikipedia.org पर उपयोग
- ps.wikipedia.org पर उपयोग
- pt.wikipedia.org पर उपयोग
- ru.wikipedia.org पर उपयोग
- sl.wikipedia.org पर उपयोग
- sr.wikipedia.org पर उपयोग
- sr.wikiquote.org पर उपयोग
- te.wikipedia.org पर उपयोग
- tr.wikipedia.org पर उपयोग
- tt.wikipedia.org पर उपयोग
- uk.wikipedia.org पर उपयोग
- vec.wikipedia.org पर उपयोग
- vi.wikipedia.org पर उपयोग
- www.wikidata.org पर उपयोग
- zh-min-nan.wikipedia.org पर उपयोग
- zh.wikipedia.org पर उपयोग