
चित्र:Components of the Cryosphere.tif
पूर्वावलोकन PNG का आकार TIF फ़ाइल: 463 × 599 पिक्सेल दूसरे रेसोल्यूशन्स: 185 × 240 पिक्सेल | 371 × 480 पिक्सेल | 593 × 768 पिक्सेल | 791 × 1,024 पिक्सेल | 2,048 × 2,650 पिक्सेल।
मूल चित्र ((2,048 × 2,650 पिक्सेल, फ़ाइल का आकार: 20.91 MB, MIME प्रकार: image/tiff))
|
|
यह फ़ाइल विकिमेडिया कॉमन्स से है। वहाँ पर इसका विवरण पृष्ठ निम्नोक्त है। कॉमन्स मुक्त लाइसेंसों के अंतर्गत उपलब्ध मीडिया फ़ाइलों का संग्रह है। आप भी इसमें मदद कर सकते हैं। |
सारांश
| विवरण |
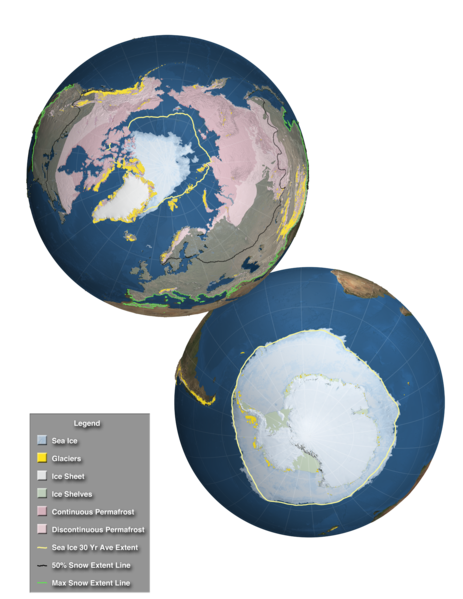
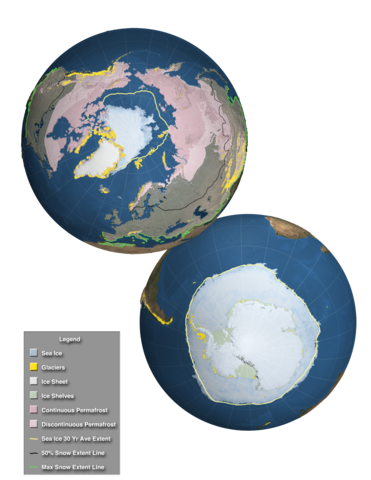
English: This high resolution image, designed for the Fifth Assessment Report of the Intergovernmental Panel on Climate Change, shows the extent of the regions affected by components of the cryosphere around the world. Over land, continuous permafrost is shown in a dark pink while discontinuous permafrost is shown in a lighter shade of pink. Over much of the northern hemisphere's land area, a semi-transparent white veil depicts the regions that are affected by snowfall at least one day during the perion 2000-2012. The bright green line along the southern border of this region shows the maximum snow extent while a black line across the North America, Europe and Asia shows the 50% snow extent line. Glaciers are shown as small golden dots in mountainous areas and in the far northern and southern latitudes. Over the water, ice shelves are shown around Antarctica along with sea ice surrounding the ice shelves. Sea ice is also shown at the North Pole. For both poles. the 30 year average sea ice extent is shown by a yellow outline. In addition, the ice sheets of Greenland and Antarctica are clearly visible. |
| दिनांक | |
| स्रोत | Goddard Multimedia |
| लेखक | NASA/Goddard Space Flight Center Scientific Visualization Studio |
लाइसेंस
| This file is in the public domain in the United States because it was solely created by NASA. NASA copyright policy states that "NASA material is not protected by copyright unless noted". (See Template:PD-USGov, NASA copyright policy page or JPL Image Use Policy.) | ||
 |
Warnings:
|
चित्र का इतिहास
फ़ाइलका पुराना अवतरण देखने के लिये दिनांक/समय पर क्लिक करें।
| दिनांक/समय | थंबनेल | आकार | सदस्य | प्रतिक्रिया | |
|---|---|---|---|---|---|
| वर्तमान | 14:22, 3 दिसम्बर 2013 |  | 2,048 × 2,650 (20.91 MB) | Originalwana | {{Information |Description ={{en|1=This high resolution image, designed for the Fifth Assessment Report of the Intergovernmental Panel on Climate Change, shows the extent of the regions affected by components of the cryosphere around the world. Over... |
चित्र का उपयोग
निम्नलिखित पन्ने इस चित्र से जुडते हैं :
चित्र का वैश्विक उपयोग
इस चित्र का उपयोग इन दूसरे विकियों में किया जाता है:
- azb.wikipedia.org पर उपयोग
- de.wikipedia.org पर उपयोग
- es.wikipedia.org पर उपयोग
- eu.wikipedia.org पर उपयोग
- fr.wiktionary.org पर उपयोग
- he.wikipedia.org पर उपयोग
- ja.wikipedia.org पर उपयोग
- ky.wikipedia.org पर उपयोग
- la.wikipedia.org पर उपयोग
- sr.wikipedia.org पर उपयोग
- sv.wikipedia.org पर उपयोग
- th.wikipedia.org पर उपयोग
- vi.wikipedia.org पर उपयोग
- www.wikidata.org पर उपयोग
- zh-yue.wikipedia.org पर उपयोग