चित्र:Post-Glacial Sea Level.png
पृष्ठ की सामग्री दूसरी भाषाओं में उपलब्ध नहीं है।
मुक्त ज्ञानकोश विकिपीडिया से

मूल चित्र((1,813 × 1,088 पिक्सेल, फ़ाइल का आकार: 371 KB, MIME प्रकार: image/png))

सारांश

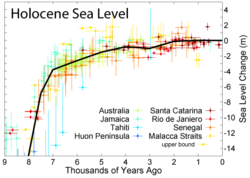
Expansion of the most recent 9 kyr

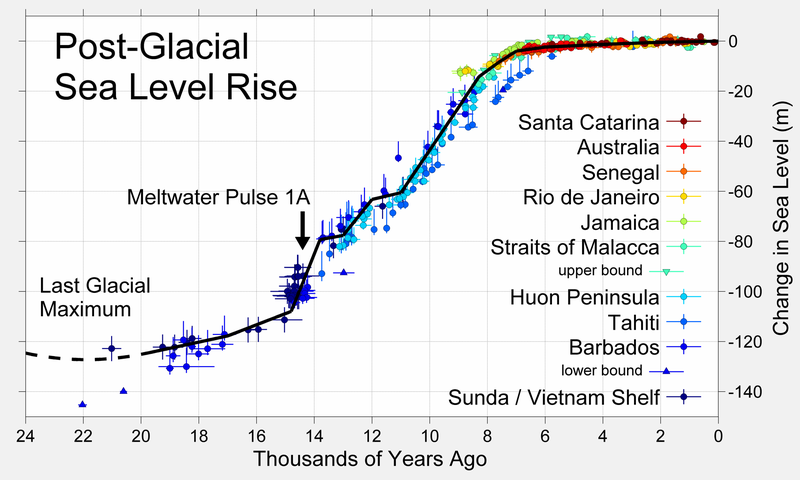
This figure shows sea level rise the end of the last glacial episode based on data from Fleming et al. 1998, Fleming 2000, and Milne et al. 2005. These papers collected data from various reports and adjusted them for subsequent vertical geologic motions, primarily those associated with post-glacial continental and hydroisostatic rebound. The first refers to deformations caused by the weight of continental ice sheets pressing down on the land the latter refers to uplift in coastal areas resulting from the increased weight of water associated with rising sea levels. Because of the latter effect and associated uplift, many islands, especially in the Pacific, experienced higher local sea levels in the mid-Holocene than they do today. Uncertainty about the magnitude of these corrections is the dominant uncertainty in many measurements of sea level change.

The black curve is based on minimizing the sum of squares error weighted distance between this curve and the plotted data. It was constructed by adjusting a number of specified tie points, typically placed every 1 kyr but at times adjusted for sparse or rapidly varying data. A small number of extreme outliers were dropped. Some authors propose the existence of significant short-term fluctuations in sea level such that the sea level curve might oscillate up and down about this ~1 kyr mean state. Others dispute this and argue that sea level change has largely been a smooth and gradual process. However, at least one episode of rapid deglaciation, known as meltwater pulse 1A, is agreed upon, and is indicated on the plot. A variety of other accelerated periods of deglaciation have been proposed (i.e. meltwater pulse 1B, 1C, 1D, 2, 3...), but it is unclear whether these actually occurred or merely reflect misinterpretation of difficult measurements. No other events are evident in the data presented above.

The lowest point of sea level during the last glaciation is not well constrained by observations (shown here as a dashed curve), but is generally argued to be approximately 130 ± 10 m below present sea level and to have occurred at approximately 22 ± 3 thousand years ago. The time of lowest sea level is more or less equivalent to the Last Glacial Maximum. Prior to this time, ice sheets were still increasing in size, so sea level had been decreasing almost continuously for approximately 100,000 years.

Copyright

This figure was prepared by Robert A. Rohde from published data, and is incorporated into the Global Warming Art project.

Image from Global Warming Art
This image is an original work created for Global Warming Art. Please refer to the image description page for more information.
GNU head इस दस्तावेज़ को Free Software Foundation द्वारा प्रकाशित GNU मुक्त प्रलेख लाइसेंस के संस्करण 1.2 या नए (बिना किसी अपरिवर्तनीय अनुभागों और अगले या पिछले आवरण के टेक्स्ट के) के अंतर्गत प्रतिलिपि बनाने, बाँटने और/या बदलने की अनुमति प्रदान की जाती है। इस लाइसेंस की एक प्रतिलिपि GNU मुक्त प्रलेख लाइसेंस नामक अनुभाग में शामिल है।
w:hi:क्रिएटिव कॉमन्स
श्रेय समानसांझा
इस फ़ाइल को क्रिएटिव कॉमन्स श्रेय-समानसांझा 3.0 अनरिपोर्टेड लाइसेंस के अंतर्गत लाइसेंस किया गया है।
आप खुलकर:
  • बाँट सकते हैं – रचना की प्रतिलिपि बना सकते हैं, बाँँट सकते हैं और संचारित कर सकते हैं
  • रीमिक्स कर सकते हैं – कार्य को अनुकूलित कर सकते हैं
निम्नलिखित शर्तों के अंतर्गत:
  • श्रेय – यह अनिवार्य है कि आप यथोचित श्रेय प्रदान करें, लाइसेंस की कड़ी प्रदान करें, और अगर कोई बदलाव हुए हों तो उन्हें इंगित करें। आप ऐसा किसी भी उचित तरीके से कर सकते हैं, लेकिन किसी भी तरह उससे यह नहीं संकेत नहीं किया जाना चाहिए कि लाइसेंसधारी द्वारा आपको अथवा आपके इस प्रयोग का समर्थन किया जा रहा हो।
  • समानसांझा – अगर आप इस रचना में कोई बदलाव करते हैं या इसपर आधारित कुछ रचित करते हैं तो आप अपने योगदान को सिर्फ इसी या इसके सामान किसी लाइसेंस के अंतर्गत बाँट सकते हैं।
This licensing tag was added to this file as part of the GFDL licensing update.


References

  • Fleming, Kevin, Paul Johnston, Dan Zwartz, Yusuke Yokoyama, Kurt Lambeck, and John Chappell (1998). "Refining the eustatic sea-level curve since the Last Glacial Maximum using far- and intermediate-field sites". Earth and Planetary Science Letters 163 (1-4): 327-342. doi:10.1016/S0012-821X(98)00198-8
  • Fleming, Kevin Michael (२०००) Glacial Rebound and Sea-level Change Constraints on the Greenland Ice Sheet, Australian National University PhD Thesis
  • Milne, Glenn A., Antony J. Long and Sophie E. Bassett (2005). "Modelling Holocene relative sea-level observations from the Caribbean and South America". Quaternary Science Reviews 24 (10-11): 1183-1202. doi:10.1016/j.quascirev.2004.10.005


This geology image could be re-created using vector graphics as an SVG file. This has several advantages; see Commons:Media for cleanup for more information. If an SVG form of this image is available, please upload it and afterwards replace this template with {{vector version available|new image name}}.


It is recommended to name the SVG file “Post-Glacial Sea Level.svg”—then the template Vector version available (or Vva) does not need the new image name parameter.

Captions

Add a one-line explanation of what this file represents

Items portrayed in this file

चित्रण

MIME type अंग्रेज़ी

image/png

चित्र का इतिहास

फ़ाइलका पुराना अवतरण देखने के लिये दिनांक/समय पर क्लिक करें।

दिनांक/समयथंबनेलआकारसदस्यप्रतिक्रिया
वर्तमान23:36, 18 मार्च 201923:36, 18 मार्च 2019 के संस्करण का थंबनेल संस्करण1,813 × 1,088 (371 KB)Dragons flightHigher resolution version
17:26, 25 नवम्बर 201617:26, 25 नवम्बर 2016 के संस्करण का थंबनेल संस्करण526 × 359 (19 KB)A876edited to correct spelling. (also OptiPNG.)
02:20, 27 दिसम्बर 200502:20, 27 दिसम्बर 2005 के संस्करण का थंबनेल संस्करण526 × 359 (23 KB)AngrenseSea level variation during the last post-glacial period. Source:English version of Wikipedia.

निम्नलिखित पन्ने इस चित्र से जुडते हैं :

चित्र का वैश्विक उपयोग

इस चित्र का उपयोग इन दूसरे विकियों में किया जाता है:

इस चित्र के वैश्विक उपयोग की अधिक जानकारी देखें।

मेटाडेटा