
चित्र:Polar Bear Habitat.png

मूल चित्र ((981 × 879 पिक्सेल, फ़ाइल का आकार: 605 KB, MIME प्रकार: image/png))
|
|
यह फ़ाइल विकिमेडिया कॉमन्स से है। वहाँ पर इसका विवरण पृष्ठ निम्नोक्त है। कॉमन्स मुक्त लाइसेंसों के अंतर्गत उपलब्ध मीडिया फ़ाइलों का संग्रह है। आप भी इसमें मदद कर सकते हैं। |
सारांश
| विवरण |
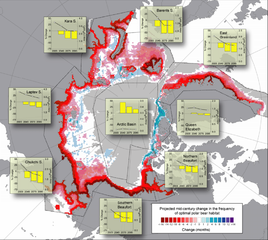
Projected changes (based on 10 IPCC AR-4 GCM models run with the SRES- A1B forcing scenario) in the spatial distribution and integrated annual area of optimal polar bear habitat. Base map shows the cumulative number of months per decade where optimal polar bear habitat was either lost (red) or gained (blue) from 2001–2010 to 2041–2050. Offshore gray shading denotes areas where optimal habitat was absent in both periods. Insets show the average annual ( 12 months) cumulative area of optimal habitat (right y-axis, line plot) for four 10-year periods in the 21st century (x-axis midpoints), and their associated percent change in area (left y axis, histograms) relative to the first decade (2001–2010). |
| स्रोत | Predicting The Future Distribution of Polar Bear Habitat in the Polar Basin from Resource Selection Functions Applied to 21st Century General Circulation Model Projections of Sea Ice |
| लेखक | USGS |
लाइसेंस
This work is in the public domain in the United States because it is a work prepared by an officer or employee of the United States Government as part of that person’s official duties under the terms of Title 17, Chapter 1, Section 105 of the US Code.
Note: This only applies to original works of the Federal Government and not to the work of any individual U.S. state, territory, commonwealth, county, municipality, or any other subdivision. This template also does not apply to postage stamp designs published by the United States Postal Service since 1978. (See § 313.6(C)(1) of Compendium of U.S. Copyright Office Practices). It also does not apply to certain US coins; see The US Mint Terms of Use.
|
 | |
| इस फ़ाइल को कॉपीराइट कानूनों के अंतर्गत सभी संबंधित अधिकारों समेत ज्ञात सीमाओं से मुक्त पहचाना गया है। | ||
चित्र का इतिहास
फ़ाइलका पुराना अवतरण देखने के लिये दिनांक/समय पर क्लिक करें।
| दिनांक/समय | थंबनेल | आकार | सदस्य | प्रतिक्रिया | |
|---|---|---|---|---|---|
| वर्तमान | 16:54, 24 नवम्बर 2010 | | 981 × 879 (605 KB) | PawełS | Bigger resolution. Screenshot of PDF in bigger zoom. |
| 22:46, 30 नवम्बर 2007 |  | 610 × 546 (423 KB) | Sagredo | {{Information |Description=Projected changes (based on 10 IPCC AR-4 GCM models run with the SRES- A1B forcing scenario) in the spatial distribution and integrated annual area of optimal polar bear habitat. Base map shows the cumulative number of months |
चित्र का उपयोग
निम्नलिखित पन्ने इस चित्र से जुडते हैं :
चित्र का वैश्विक उपयोग
इस चित्र का उपयोग इन दूसरे विकियों में किया जाता है:
- ar.wikipedia.org पर उपयोग
- ca.wikipedia.org पर उपयोग
- cs.wikipedia.org पर उपयोग
- de.wikipedia.org पर उपयोग
- en.wikipedia.org पर उपयोग
- eo.wikipedia.org पर उपयोग
- es.wikipedia.org पर उपयोग
- fr.wikipedia.org पर उपयोग
- gl.wikipedia.org पर उपयोग
- gu.wikipedia.org पर उपयोग
- kn.wikipedia.org पर उपयोग
- pt.wikipedia.org पर उपयोग
- si.wikipedia.org पर उपयोग
- vi.wikipedia.org पर उपयोग
- zh.wikipedia.org पर उपयोग