
चित्र:Nyquist example.svg

पूर्वावलोकन PNG का आकार SVG फ़ाइल: 443 × 428 पिक्सेल दूसरे रेसोल्यूशन्स: 248 × 240 पिक्सेल | 497 × 480 पिक्सेल | 795 × 768 पिक्सेल | 1,060 × 1,024 पिक्सेल | 2,120 × 2,048 पिक्सेल।
मूल चित्र (SVG फ़ाइल, साधारणतः 443 × 428 पिक्सेल, फ़ाइल का आकार: 53 KB)
|
|
यह फ़ाइल विकिमेडिया कॉमन्स से है। वहाँ पर इसका विवरण पृष्ठ निम्नोक्त है। कॉमन्स मुक्त लाइसेंसों के अंतर्गत उपलब्ध मीडिया फ़ाइलों का संग्रह है। आप भी इसमें मदद कर सकते हैं। |
सारांश
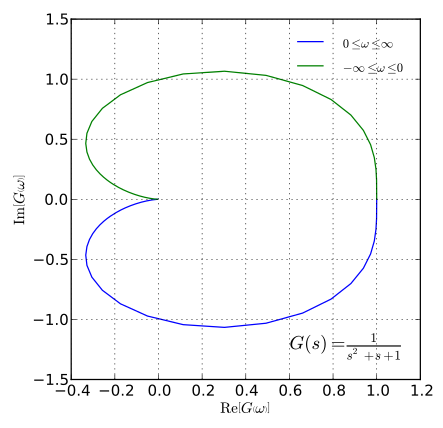
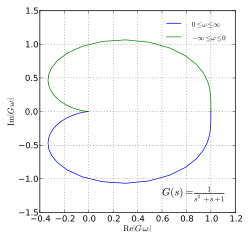
| विवरण | The Nyquist Plot for a sample function that can be converted to frequency by replacing with (imaginary frequency) and . Created using Python and matplotlib. |
| दिनांक | |
| स्रोत | अपना कार्य |
| लेखक | Utkarsh Upadhyay,--Krishnavedala (talk) 20:21, 3 June 2011 (UTC) (python version) |
| अनुमति (इस चित्र का पुनः उपयोग करना) |
Public Domain |


W3C-validity not checked.
| Source Code |
|---|
from numpy import *
from matplotlib.pyplot import *

def nyquist(w):		# compute the complex Nyquist response
	s = complex(0,w)
	return (1/(s**2+s+1))

fig = figure(figsize=(5,5))
ax = fig.add_subplot(111)
ax.grid(True)

t, N = linspace(0,5*pi,200), [] # 5*pi is approx. to infinity.
for i in t:			# compute the complex response for +ve omega
	N = append(N,nyquist(i))
ax.plot(real(N),imag(N),label=r"$0\leq\omega\leq\infty$")
t, N = linspace(-5*pi,0,200), []
for i in t:			# compute the complex response for -ve omega
	N = append(N,nyquist(i))
ax.plot(real(N),imag(N),label=r"$-\infty\leq\omega\leq 0$")
ax.legend(frameon=False)
setp(ax.get_legend().get_texts(),fontsize='small')
ax.set_xlabel(r"$\mathrm{Re}\left[G\left(\omega\right)\right]$")
ax.set_ylabel(r"$\mathrm{Im}\left[G\left(\omega\right)\right]$")
ax.text(0.6,-1.25,r"$G(s)=\frac{1}{s^2+s+1}$",\
	fontsize=15)

#fig.show()
fig.savefig("Nyquist example.svg",bbox_inches="tight",\
	pad_inches=.15)
|
लाइसेंस
| मैं, इस कार्य का/की कॉपीराइट धारक, इस कार्य को सार्वजनिक डोमेन में प्रकाशित करता/करती हूँ। यह पूरे विश्व में लागू होता है। कुछ देशों में यह कानूनी तौर पर नहीं हो सकता है; ऐसा हो तो: मैं सभी को इस कार्य का इस्तेमाल किसी भी उद्देश्य से, बिना किसी बाधाओं के इन शर्तों के कानून द्वारा अनिवार्य किए तक करने की अनुमति देता/देती हूँ। |
चित्र का इतिहास
फ़ाइलका पुराना अवतरण देखने के लिये दिनांक/समय पर क्लिक करें।
| दिनांक/समय | थंबनेल | आकार | सदस्य | प्रतिक्रिया | |
|---|---|---|---|---|---|
| वर्तमान | 20:10, 3 जून 2011 | | 443 × 428 (53 KB) | Krishnavedala | corrected the equation in the curve |
| 20:04, 3 जून 2011 |  | 443 × 428 (53 KB) | Krishnavedala | a well defined curve | |
| 20:55, 1 जुलाई 2010 |  | 1,000 × 1,000 (7 KB) | DieBucheBot | Trying to fix SVG using scour | |
| 02:36, 27 मार्च 2007 |  | 1,000 × 1,000 (11 KB) | Musically ut | {{Information |Description=The Nyquist Plot for a sample function. |Source=Octave and GNU Plot |Date=27/03/06 |Author=Utkarsh Upadhyay |Permission=Public Domain |other_versions= - }} |
चित्र का उपयोग
निम्नलिखित पन्ने इस चित्र से जुडते हैं :
चित्र का वैश्विक उपयोग
इस चित्र का उपयोग इन दूसरे विकियों में किया जाता है:
- en.wikipedia.org पर उपयोग
- fa.wikipedia.org पर उपयोग
- fr.wikipedia.org पर उपयोग
- it.wikipedia.org पर उपयोग
- pt.wikipedia.org पर उपयोग
- tr.wikipedia.org पर उपयोग
- vi.wikipedia.org पर उपयोग
- zh.wikipedia.org पर उपयोग