
चित्र:Linear least squares2.png

इस पूर्वावलोकन का आकार: 499 × 599 पिक्सेल। दूसरे रेसोल्यूशन्स: 200 × 240 पिक्सेल | 400 × 480 पिक्सेल | 889 × 1,067 पिक्सेल।
मूल चित्र ((889 × 1,067 पिक्सेल, फ़ाइल का आकार: 30 KB, MIME प्रकार: image/png))
|
|
यह फ़ाइल विकिमेडिया कॉमन्स से है। वहाँ पर इसका विवरण पृष्ठ निम्नोक्त है। कॉमन्स मुक्त लाइसेंसों के अंतर्गत उपलब्ध मीडिया फ़ाइलों का संग्रह है। आप भी इसमें मदद कर सकते हैं। |
सारांश
| विवरण |
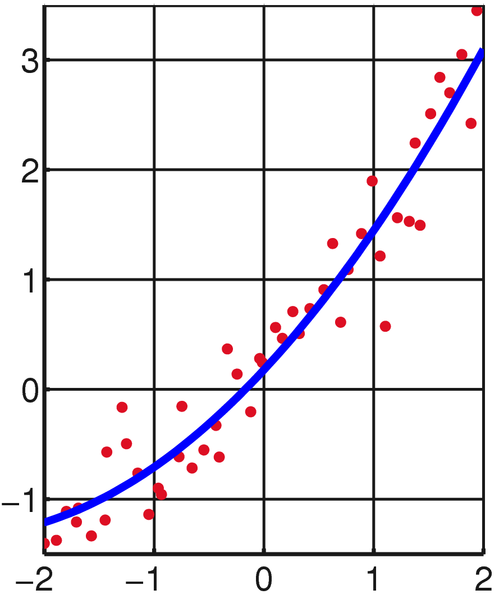
English: Illustration of linear least squares. |
|||
| दिनांक | (UTC) | |||
| स्रोत | self-made with MATLAB, tweaked in Inkscape. | |||
| लेखक | Oleg Alexandrov | |||
| दूसरे संस्करण |
|


| मैं, इस कार्य का/की कॉपीराइट धारक, इस कार्य को सार्वजनिक डोमेन में प्रकाशित करता/करती हूँ। यह पूरे विश्व में लागू होता है। कुछ देशों में यह कानूनी तौर पर नहीं हो सकता है; ऐसा हो तो: मैं सभी को इस कार्य का इस्तेमाल किसी भी उद्देश्य से, बिना किसी बाधाओं के इन शर्तों के कानून द्वारा अनिवार्य किए तक करने की अनुमति देता/देती हूँ। |
Source code (MATLAB)
% Illustration of linear least squares.
function main()

   % KSmrq's colors
   red    = [0.867 0.06 0.14];
   blue   = [0, 129, 205]/256;
   green  = [0, 200,  78]/256;
   yellow = [2764, 194,   0]/256;
   white = 0.99*[1, 1, 1];
   gray = 0.1*white;

% Set up the grid and other parameters
   N = 100;
   A = -2.2; B = 7;
   X = linspace(A, B, N);
   C=-4; D = 4;

   % Set up the figure
   lw = 5; % linewidth
   lw2 = lw/2;
   fs = 22; % font size
   figure(1); clf; hold on;
   set(gca, 'fontsize', fs);
   set(gca, 'linewidth', lw2)
   hold on; grid on;

   % random numbers
   s=0.16;
   a = 1.7; b = 3; c = 1;
   p = 1; q = 75; r = 1.3;
   M = 50;
   p = s*p; q = s*q; r = s*r;
   XX=linspace(A, B, M+1);
   YY = p+q*XX+r*XX.^2;

   Xr = 7*(1:M);
   Yr = Xr;
   for i=1:M
      rd=rand(1);
      Xr(i) = XX(i)*rd+XX(i+1)*(1-rd);
      Yr(i) = p+q*Xr(i)+r*Xr(i)^2 + 0.4*erfinv(2*rand(1) - 1);
   end

   myrad = 0.05;
   for i=1:length(Xr)
      ball(Xr(i), Yr(i), myrad, red);
   end

   axis equal;


   % least squares fitting
   Yr = Yr';
   Xr=Xr';
   Mat = [(0*Xr+1) Xr Xr.^2];
   V=Mat'*Yr;
   V=(Mat'*Mat)\V;
   pe = V(1); qe = V(2); re=V(3);

   plot(X, pe+qe*X+re*X.^2, 'b', 'linewidth', lw);

   grid on;
   set(gca, 'GridLineStyle', '-', 'xcolor', gray);
   set(gca, 'GridLineStyle', '-', 'ycolor', gray);
   set(gca, 'XTick', [-2 -1 0 1 2]);
   plot([-2 2], [3.5 3.5], 'linewidth', lw2, 'color', gray);

   axis equal;
   axis([-2, 2, -1.7, 3.5]);

   saveas(gcf, 'Linear_least_squares2.eps', 'psc2'); % save as eps
   %plot2svg('Linear_least_squares.svg'); % save as svg


function ball(x, y, r, color)
   Theta=0:0.7:2*pi;
   X=r*cos(Theta)+x;
   Y=r*sin(Theta)+y;
   H=fill(X, Y, color);
   set(H, 'EdgeColor', 'none')
चित्र का इतिहास
फ़ाइलका पुराना अवतरण देखने के लिये दिनांक/समय पर क्लिक करें।
| दिनांक/समय | थंबनेल | आकार | सदस्य | प्रतिक्रिया | |
|---|---|---|---|---|---|
| वर्तमान | 20:10, 21 फ़रवरी 2009 | | 889 × 1,067 (30 KB) | Oleg Alexandrov | Normal noise, per Michael Hardy |
| 06:32, 5 अप्रैल 2008 |  | 889 × 1,067 (34 KB) | Oleg Alexandrov | tweak | |
| 06:30, 5 अप्रैल 2008 |  | 889 × 1,067 (35 KB) | Oleg Alexandrov | tweak | |
| 06:29, 5 अप्रैल 2008 |  | 889 × 1,067 (34 KB) | Oleg Alexandrov | tweak | |
| 06:28, 5 अप्रैल 2008 |  | 444 × 533 (17 KB) | Oleg Alexandrov | ||
| 06:25, 5 अप्रैल 2008 |  | 444 × 533 (16 KB) | Oleg Alexandrov | tweak | |
| 06:21, 5 अप्रैल 2008 |  | 444 × 533 (16 KB) | Oleg Alexandrov | {{Information |Description=Illustration of linear least squares. |Source=self-made with MATLAB, tweaked in Inkscape. |Date=~~~~~ |Author= Oleg Alexandrov |Permission=See below |other_versions= }} {{PD |
चित्र का उपयोग
निम्नलिखित पन्ने इस चित्र से जुडते हैं :
चित्र का वैश्विक उपयोग
इस चित्र का उपयोग इन दूसरे विकियों में किया जाता है:
- ar.wikipedia.org पर उपयोग
- bg.wikipedia.org पर उपयोग
- ca.wikipedia.org पर उपयोग
- de.wikipedia.org पर उपयोग
- en.wikipedia.org पर उपयोग
- eo.wikipedia.org पर उपयोग
- es.wikipedia.org पर उपयोग
- hu.wikipedia.org पर उपयोग
- ja.wikipedia.org पर उपयोग
- uk.wikipedia.org पर उपयोग
- vi.wikipedia.org पर उपयोग
- zh.wikipedia.org पर उपयोग