
चित्र:Indicator function illustration.png

इस पूर्वावलोकन का आकार: 800 × 508 पिक्सेल। दूसरे रेसोल्यूशन्स: 320 × 203 पिक्सेल | 640 × 406 पिक्सेल | 813 × 516 पिक्सेल।
मूल चित्र ((813 × 516 पिक्सेल, फ़ाइल का आकार: 19 KB, MIME प्रकार: image/png))
|
|
यह फ़ाइल विकिमेडिया कॉमन्स से है। वहाँ पर इसका विवरण पृष्ठ निम्नोक्त है। कॉमन्स मुक्त लाइसेंसों के अंतर्गत उपलब्ध मीडिया फ़ाइलों का संग्रह है। आप भी इसमें मदद कर सकते हैं। |
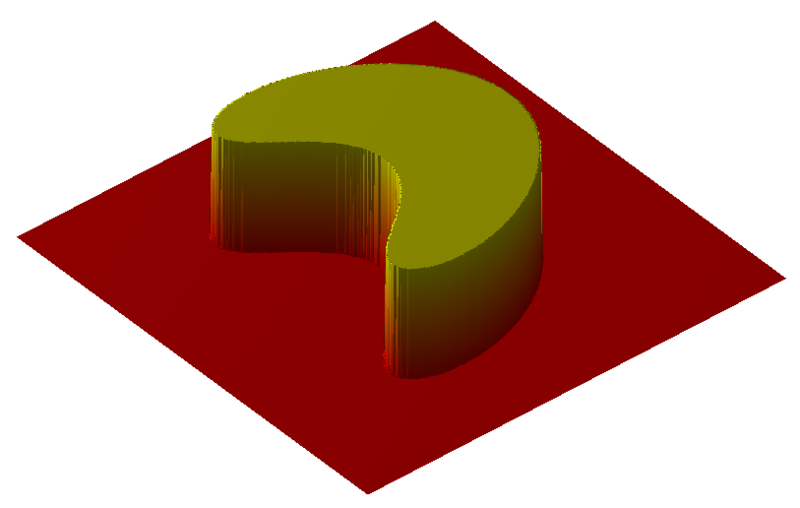
| विवरण | Illustration of an en:Indicator function. |
| दिनांक | (UTC) |
| स्रोत | self-made with MATLAB, source code below |
| लेखक | Oleg Alexandrov |
| मैं, इस कार्य का/की कॉपीराइट धारक, इस कार्य को सार्वजनिक डोमेन में प्रकाशित करता/करती हूँ। यह पूरे विश्व में लागू होता है। कुछ देशों में यह कानूनी तौर पर नहीं हो सकता है; ऐसा हो तो: मैं सभी को इस कार्य का इस्तेमाल किसी भी उद्देश्य से, बिना किसी बाधाओं के इन शर्तों के कानून द्वारा अनिवार्य किए तक करने की अनुमति देता/देती हूँ। |
Source code (MATLAB)
% illustration of an indicator function in two dimensions
function main()

   % the number of data points. More points means prettier picture.
   N = 400;

   % a function close to what we want, but not smooth
   Z = get_step_function (N);

% plot the surface
   figure(2); clf; hold on; axis equal; axis off;
   scale = 100;
   surf(scale*Z);

% make the surface beautiful
   shading interp;
   colormap autumn;

% add in a source of light
   camlight (-50, 54);

% viewing angle
   view(-40, 38);

   % save as png
   print('-dpng', '-r200', 'Indicator_function_illustration.png');


% get a function which is 1 on a set, and 0 outside of it
function Z = get_step_function(N)
   XX = linspace(-1.5, 4, N);
   YY = linspace(-4, 4, N);
   [X, Y] = meshgrid(XX, YY);

   c = 2;
   k=1.2;
   shift=10;
   Z = (c^2-X.^2-Y.^2).^2 + k*(c-X).^3-shift;

   Z =1-max(sign(Z), 0);

|
This math image could be re-created using vector graphics as an SVG file. This has several advantages; see Commons:Media for cleanup for more information. If an SVG form of this image is available, please upload it and afterwards replace this template with
{{vector version available|new image name}}.
It is recommended to name the SVG file “Indicator function illustration.svg”—then the template Vector version available (or Vva) does not need the new image name parameter. |
चित्र का इतिहास
फ़ाइलका पुराना अवतरण देखने के लिये दिनांक/समय पर क्लिक करें।
| दिनांक/समय | थंबनेल | आकार | सदस्य | प्रतिक्रिया | |
|---|---|---|---|---|---|
| वर्तमान | 01:49, 27 सितंबर 2007 | | 813 × 516 (19 KB) | Oleg Alexandrov | {{Information |Description=Illustration of an en:Indicator function. |Source=self-made with MATLAB, source code below |Date=~~~~~ |Author= Oleg Alexandrov }} <pre><nowiki> % illustration of an indicator function in two dime |
चित्र का उपयोग
निम्नलिखित पन्ने इस चित्र से जुडते हैं :
चित्र का वैश्विक उपयोग
इस चित्र का उपयोग इन दूसरे विकियों में किया जाता है:
- de.wikipedia.org पर उपयोग
- en.wikipedia.org पर उपयोग
- en.wikibooks.org पर उपयोग
- es.wikipedia.org पर उपयोग
- fi.wikipedia.org पर उपयोग
- fr.wikipedia.org पर उपयोग
- id.wikipedia.org पर उपयोग
- it.wikipedia.org पर उपयोग
- ko.wikipedia.org पर उपयोग
- ms.wikipedia.org पर उपयोग
- nl.wikipedia.org पर उपयोग
- sq.wikipedia.org पर उपयोग
- sr.wikipedia.org पर उपयोग
- sv.wikipedia.org पर उपयोग
- ta.wikipedia.org पर उपयोग
- uk.wikipedia.org पर उपयोग
- vi.wikipedia.org पर उपयोग