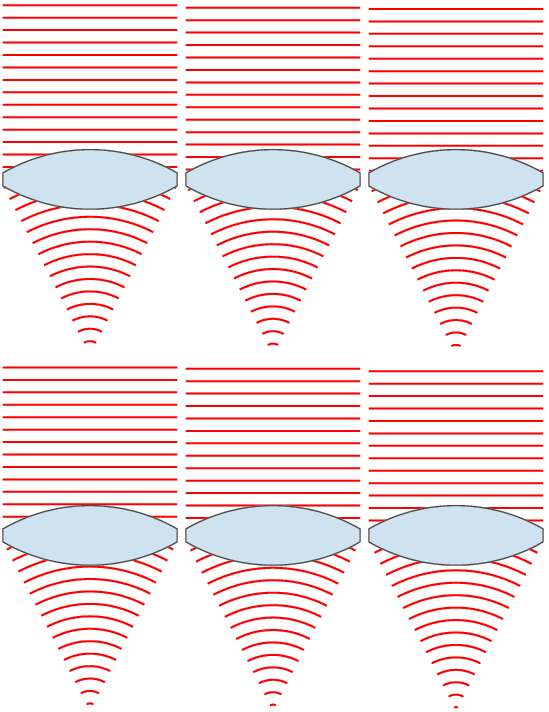
चित्र:Lens and wavefronts.gif

पृष्ठ की सामग्री दूसरी भाषाओं में उपलब्ध नहीं है।
मुक्त ज्ञानकोश विकिपीडिया से

Lens_and_wavefronts.gif((183 × 356 पिक्सेल, फ़ाइल का आकार: 35 KB, MIME प्रकार: image/gif), चक्रित, 9 ढाँचे, 0.7 s)

slnglelens

सारांश

विवरण Illustration of wavefronts after passing through a lens. Interestingly, to produce a point source reverse the direction of the waves, with the focus point acting as a point source.
दिनांक (UTC)
स्रोत self-made with MATLAB
लेखक Oleg Alexandrov
दूसरे संस्करण
 
इस GIF ग्राफ़िक को MATLAB की मदद से बनाया गया था.

लाइसेंस

Public domain मैं, इस कार्य का/की कॉपीराइट धारक, इस कार्य को सार्वजनिक डोमेन में प्रकाशित करता/करती हूँ। यह पूरे विश्व में लागू होता है।
कुछ देशों में यह कानूनी तौर पर नहीं हो सकता है; ऐसा हो तो:
मैं सभी को इस कार्य का इस्तेमाल किसी भी उद्देश्य से, बिना किसी बाधाओं के इन शर्तों के कानून द्वारा अनिवार्य किए तक करने की अनुमति देता/देती हूँ।

siingleline

% Illustration of planar wavefronts going through a lens and getting focused
% into a converging spherical wave

function main ()

  % lens index
   n=1.5; 

  % number of points, used for plotting
   N = 100;

  % radii of lens surfaces
   R1 = 0.5; 
   R2 = 1.5;

  % centers of circles (y coord is 0)
   O1 = -2.9;
   O2 = -O1;

  % focal length
   f = (n-1)*(1/R1+1/R2); f = 1/f;
   
   % theta0 determines the width of the lens
   theta0=pi/6;
   Theta = linspace(-theta0, theta0, N);

  % right face of the lens
   L1x = R1*cos(Theta)+O1;
   L1y =R1*sin(Theta); 

   % left size of the lens
   L2x=-R2*cos(Theta)+O2;
   L2y = R2*sin(Theta);

   % flat top part
   Topx = [L1x(N), L2x(N)];
   Topy = [L1y(N), L2y(N)];

   % flat bottom part
   Botx = [L1x(1) L2x(1)];
   Boty = [L1y(1), L2y(1)];

   % the lens
   Lensx = [L1x rv_vec(Topx), rv_vec(L2x), Botx];
   Lensy = [L1y rv_vec(Topy), rv_vec(L2y), Boty];

   % Parameters for graphing
   Lens_color  = [204, 226, 239]/256;
   Lens_border = 0.3*[1, 1, 1];
   lbw = 1.3; % lens border width
   wavefr_color = [1, 0, 0];
   wavefr_bdw   = 2;
   
   % spacing between wavefronts (both plane and spherical ones)
   spacing = 0.25;

   % 2*H is the height of the plane wavefronts
   H = L1y(N); 

   % theta2 = slope of the line going from the upper-right
   % end of the lens to the focus point
   theta2 = atan(L1y(N)/(f-L1x(N)));

   % Shape of the spherical wavefronts.
   Theta = linspace(-theta2, theta2, N);
   X = -cos(Theta);
   Y =  sin(Theta);

   S = -f; % start ploting waves from here to the right

   % number of frames in the movie
   num_frames = 10;
   Shifts = linspace(0, spacing, num_frames+1);

   % start at S+shift, plot the wavefronts
   for frame_no = 1:num_frames

      shift = Shifts(frame_no);
      
      s = S+shift;

      % plotting window
      figure(1); clf; hold on; axis equal; axis off;

      % plot the plane wavefronts
      while s < 0
         plot([s, s], [-H, H], 'color', wavefr_color, 'linewidth', wavefr_bdw);
         s = s + spacing;
      end
      
   
      % plot the spherical wavefronts
      s = s - 10*spacing; % backtrack a bit
      while s < f
         
         rho = f-s;
         
         if rho*Y(N) <= L1y(N)
            plot(rho*X+f, rho*Y, 'color', wavefr_color, 'linewidth', wavefr_bdw);
         end
         
         s = s + spacing;
         
      end

      % plot the lens
      fill(Lensx, Lensy, Lens_color, 'EdgeColor', Lens_border, 'LineWidth', lbw);
%      get(H)
%      return
      
      % Invisible points to force MATLAB to keep the
      % plotting window fixed.
      tiny = 0.15*spacing;
      white = 0.999*[1, 1, 1];
      plot(S-tiny,   H+tiny, 'color', white);
      plot(S-tiny,  -H-tiny, 'color', white);
      plot(f+tiny,   H+tiny, 'color', white);
      plot(f+tiny,  -H-tiny, 'color', white);

      % Rotate by 90 degrees
      set(gca, 'View', [90, 90])

      % save current file
      frame_file = sprintf('Frame%d.eps', 1000+frame_no);
      disp(frame_file);
      saveas(gcf, frame_file, 'psc2');
      pause(0.07)
   end

% The frames were converted to a movie with the command
% convert -antialias -loop 10000  -delay 8 -compress LZW Frame100* Lens_and_wavefronts.gif
   
function W = rv_vec(V)

   K = length(V);

   W = V;
   for i=1:K
      W(i) = V(K-i+1);
   end

Captions

Add a one-line explanation of what this file represents
Siingleline

Items portrayed in this file

चित्रण

२४ नवम्बर 2007

MIME type अंग्रेज़ी

image/gif

चित्र का इतिहास

फ़ाइलका पुराना अवतरण देखने के लिये दिनांक/समय पर क्लिक करें।

दिनांक/समयथंबनेलआकारसदस्यप्रतिक्रिया
वर्तमान06:35, 25 नवम्बर 200706:35, 25 नवम्बर 2007 के संस्करण का थंबनेल संस्करण183 × 356 (35 KB)Oleg Alexandrovtweak
04:10, 24 नवम्बर 200704:10, 24 नवम्बर 2007 के संस्करण का थंबनेल संस्करण171 × 356 (33 KB)Oleg Alexandrovtweak
04:09, 24 नवम्बर 200704:09, 24 नवम्बर 2007 के संस्करण का थंबनेल संस्करण171 × 356 (33 KB)Oleg Alexandrovtweak
00:56, 24 नवम्बर 200700:56, 24 नवम्बर 2007 के संस्करण का थंबनेल संस्करण171 × 359 (33 KB)Oleg Alexandrovtweak, same license
00:53, 24 नवम्बर 200700:53, 24 नवम्बर 2007 के संस्करण का थंबनेल संस्करण171 × 359 (32 KB)Oleg Alexandrovtweak
00:49, 24 नवम्बर 200700:49, 24 नवम्बर 2007 के संस्करण का थंबनेल संस्करण151 × 359 (31 KB)Oleg Alexandrov{{Information |Description=Illustration of wavefronts after passing through a [:en:lens (optics)|lens]] |Source=self-made with MATLAB |Date=~~~~~ |Author= Oleg Alexandrov |Permission=see below |other_versions= }}

निम्नलिखित पन्ने इस चित्र से जुडते हैं :

चित्र का वैश्विक उपयोग

इस चित्र का उपयोग इन दूसरे विकियों में किया जाता है:

इस चित्र के वैश्विक उपयोग की अधिक जानकारी देखें।