
चित्र:Budget vs Income James Bond.jpg
इस पूर्वावलोकन का आकार: 800 × 547 पिक्सेल। दूसरे रेसोल्यूशन्स: 320 × 219 पिक्सेल | 640 × 437 पिक्सेल | 910 × 622 पिक्सेल।
मूल चित्र ((910 × 622 पिक्सेल, फ़ाइल का आकार: 132 KB, MIME प्रकार: image/jpeg))
|
|
यह फ़ाइल विकिमेडिया कॉमन्स से है। वहाँ पर इसका विवरण पृष्ठ निम्नोक्त है। कॉमन्स मुक्त लाइसेंसों के अंतर्गत उपलब्ध मीडिया फ़ाइलों का संग्रह है। आप भी इसमें मदद कर सकते हैं। |
सारांश

|
This graph image could be re-created using vector graphics as an SVG file. This has several advantages; see Commons:Media for cleanup for more information. If an SVG form of this image is available, please upload it and afterwards replace this template with
{{vector version available|new image name}}.
It is recommended to name the SVG file “Budget vs Income James Bond.svg”—then the template Vector version available (or Vva) does not need the new image name parameter. |


| विवरण |
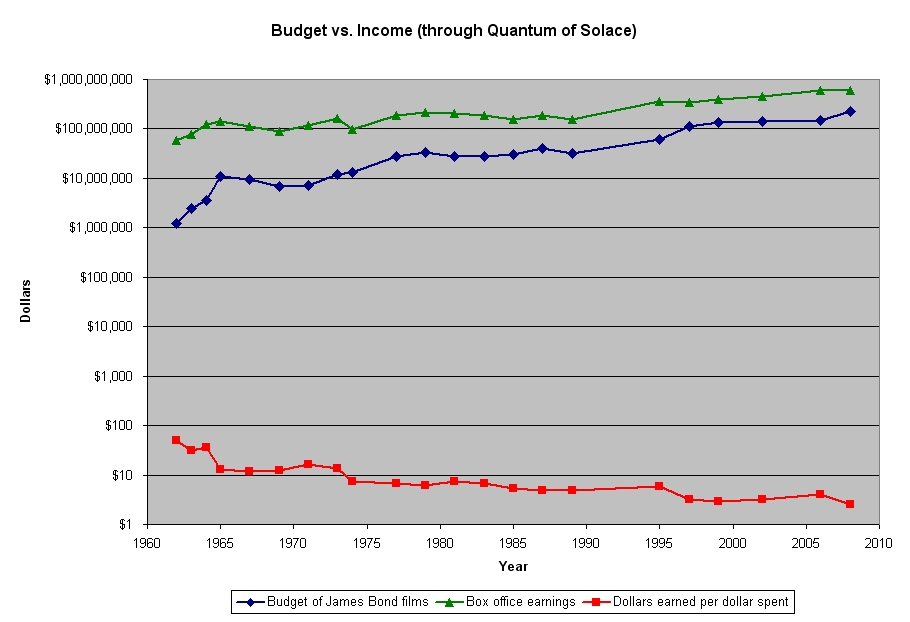
English: This chart uses a logarithmic scale to chart the cost of producing a James Bond film and relate it to the profit, measured in dollars made per dollar spent. |
| दिनांक | 12/1/2008 |
| स्रोत | अपना कार्य |
| लेखक | Jmichael9870 |
लाइसेंस
| मैं, इस कार्य का/की कॉपीराइट धारक, इस कार्य को सार्वजनिक डोमेन में प्रकाशित करता/करती हूँ। यह पूरे विश्व में लागू होता है। कुछ देशों में यह कानूनी तौर पर नहीं हो सकता है; ऐसा हो तो: मैं सभी को इस कार्य का इस्तेमाल किसी भी उद्देश्य से, बिना किसी बाधाओं के इन शर्तों के कानून द्वारा अनिवार्य किए तक करने की अनुमति देता/देती हूँ। |
चित्र का इतिहास
फ़ाइलका पुराना अवतरण देखने के लिये दिनांक/समय पर क्लिक करें।
| दिनांक/समय | थंबनेल | आकार | सदस्य | प्रतिक्रिया | |
|---|---|---|---|---|---|
| वर्तमान | 15:15, 9 जनवरी 2012 | | 910 × 622 (132 KB) | Proctris | Added "earnings" to graph. |
| 15:04, 9 जनवरी 2012 |  | 1,047 × 716 (138 KB) | Proctris | Updated through latest Bond film (Quantum of Solace); corrected spelling. | |
| 03:45, 2 दिसम्बर 2008 |  | 682 × 534 (42 KB) | Jmichael9870 | {{Information |Description={{en|1=This chart uses a logarithmic scale to chart the cost of producing a James Bond film and relate it to the profit, measured in dollars made per dollar spent. }} |Source=Own work by uploader |Author=[[User:Jmichael9870|Jmi |
चित्र का उपयोग
निम्नलिखित पन्ने इस चित्र से जुडते हैं :
चित्र का वैश्विक उपयोग
इस चित्र का उपयोग इन दूसरे विकियों में किया जाता है:
- ar.wikipedia.org पर उपयोग
- fr.wikipedia.org पर उपयोग